How about finding a way to make the best of the renewed Jennifer X-View transaction analysis page?

Are you using an APM (Application Performance Management) solution called Jennifer? We will show you the hidden features of the newly upgraded X-view and how to make the best of it.
Check your desired data more easily.
In Jennifer 5.5.3 Version, lots of pages are renewed. Most of all, there are many changes in the X-View. In this posting, we will summarize the improved features in the X-View transaction analysis page and how to make the best of it. X
Dragging interactions within the X-View chart, Two new features
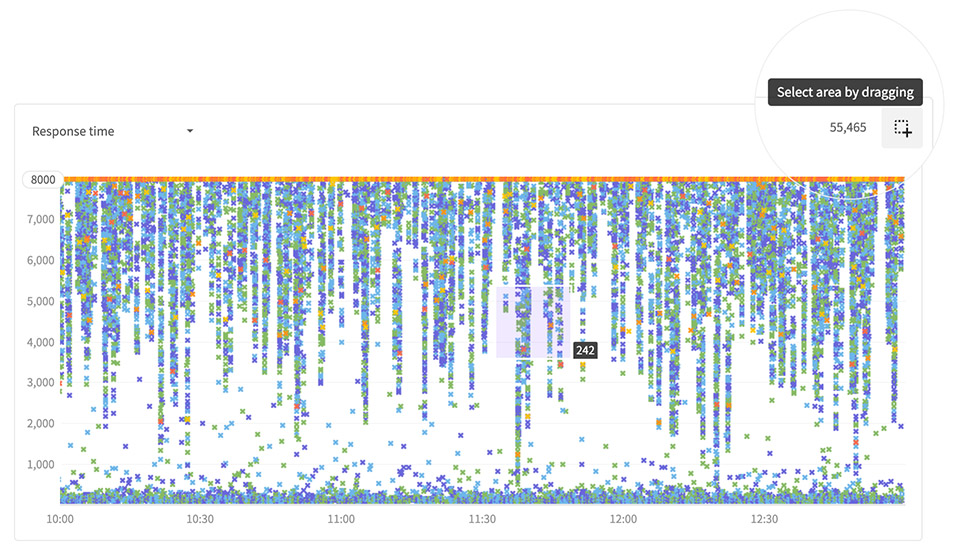
Drag to select an area
By default, dragging interaction within a chart is set to ‘Drag to select an area’ feature. Using the feature, you can launch the ‘X-View transaction analysis pop-up’ window.
Drag to extend the time
If you press the top button in a chart, you can switch to the ‘Drag to extend time’ feature. Each time you press the button, you can switch between two features, Using this feature, you can check the precise distribution of items in a chart by making the time interval for the same width denser. The ‘Drag to extend time’ feature is used to save the ‘Start/End time’ in a stack
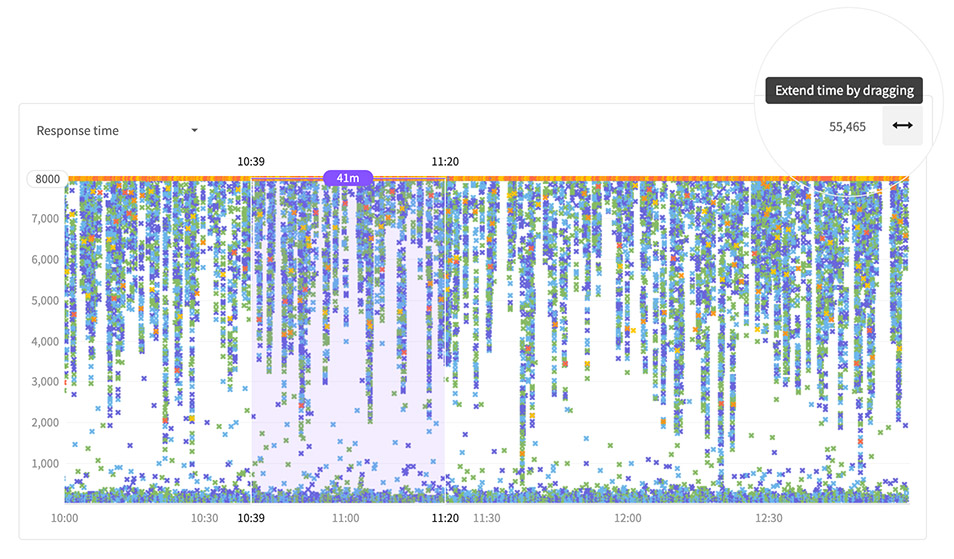
If your viewing time is 10:00 ~ 13:00 , then you can extend the time range in the following order to check the distribution more accurately.
- 10:39 ~ 11:20
- 10:50 ~ 11:10
- 10:55 ~ 11:05
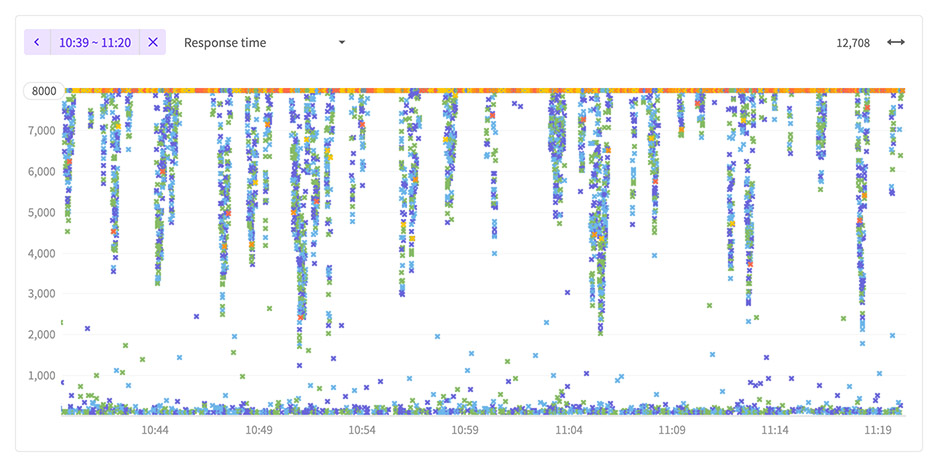
After step 3), you will see the time range of 10:55 ~ 11:05 on the axis. Now, click the ‘<’ button to return to the previous time range. Click once to return to step 2). Click twice to return to step 1). Click the ‘x’ button to initialize it.
Provides various view types with various merits.
‘Transaction’ tab provides three types of views such as ‘Application/chart views’, ‘Chart views’ and ‘Table views’. You can easily switch to other view types with different advantages.
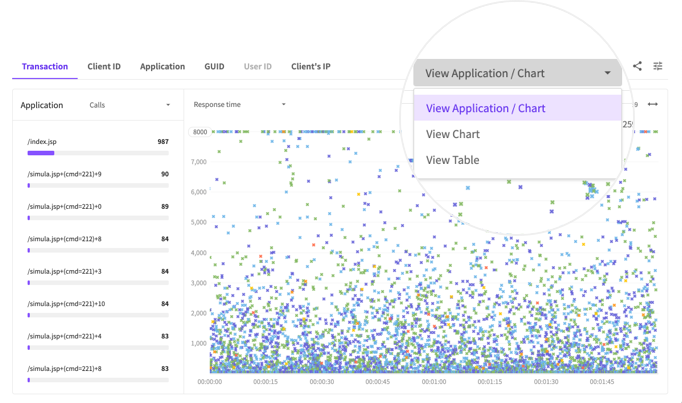
Appliction / chart view
- This is a default view. You can view application-based transaction statistics and transaction scatter charts at the same time.
- You can learn about the application calls while viewing the transaction distribution.
Chart view
- Focus on viewing the transaction distribution. Maximizes the width to make it easy to view the distribution.
Table view
- This view is useful if you want to check the transaction fields when there are few transactions.
- Provides the ‘Export CSV’ feature. You can download the raw data and check it in the spreadsheet.
Y-axis value change
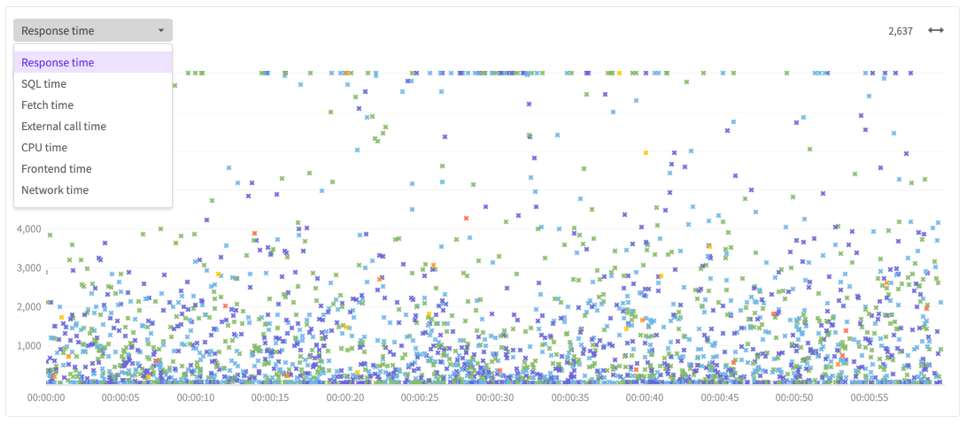
Y-axis perspective change
Besides the response time, you can change the Y-axis values by applying perspectives such as SQL time, fetch time, external call time, and so on, which are components of the response time. In detailed perspectives, you can check why execution in a specific section took so long.
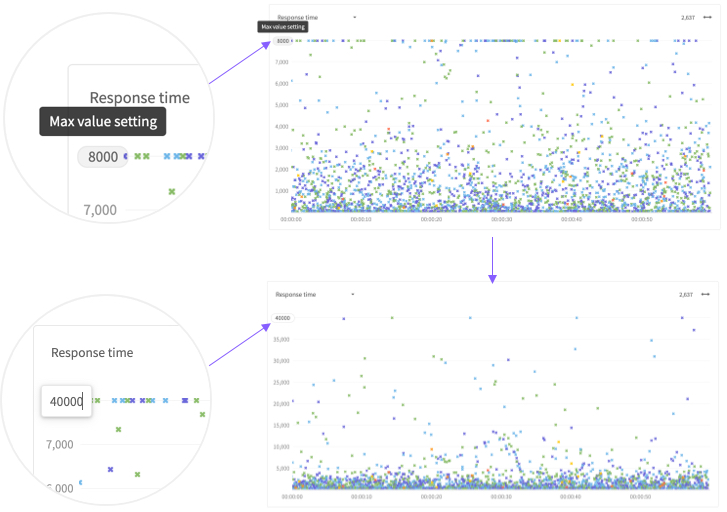
Y-axis max value change
In the X-View chart, transactions with response times greater than the maximum are determined as noises and thus all of them are displayed at the top of Y-axis. For this reason, if transactions have response times greater than the maximum, it would be hard to know which one is slower. However, some clients would want to analyze transactions with a response time above the maximum. In this case, you can set the maximum differently to perform a detailed analysis of the response time above the maximum.
Transaction group, Easily check the problems in a specific transaction group!
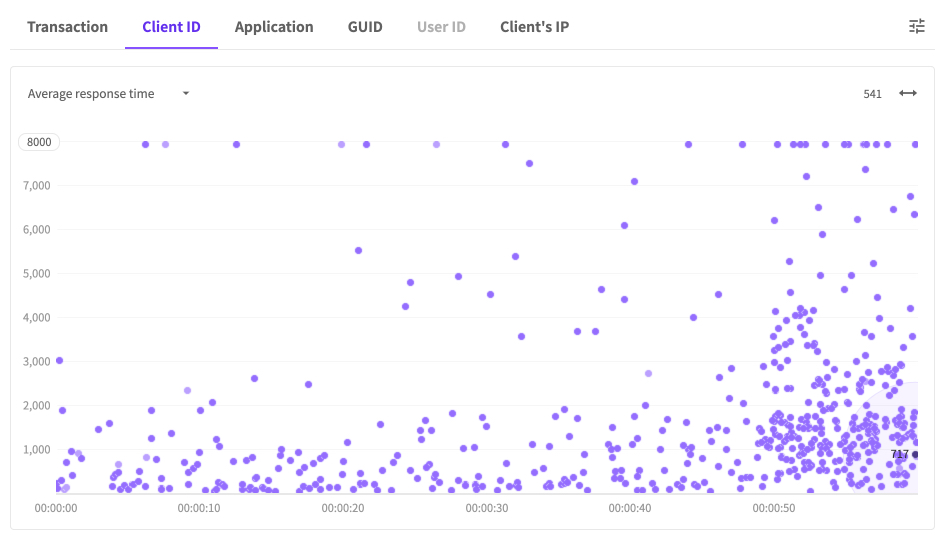
Transactions are grouped by ‘Client ID’, ‘Application’, ‘GUID’, ‘User ID’, and ‘Client’s IP address’. You can easily check applications with problems in a specific group. If there is no data to display in the transaction data (RAW) field, it is deactivated.

If there are more than or equal to 100 transactions in a group, then a circle and a number are additionally displayed. From this, you can check why there is a sudden jump in the ‘Response time’ of a specific transaction group.
Search
condition before performing searches.
Let’s use the search condition!
In one transaction, there are many fields such as target information (domain, business, and instance), client’s IP address, start time, response time, and application name. The more the transactions are viewed the greater amount of JS HeapMemory is used by the browser. If you try to view more than 1 million cases, the screen (browser) slows down as a result, and in some cases, the Chrome browser will look like the following.
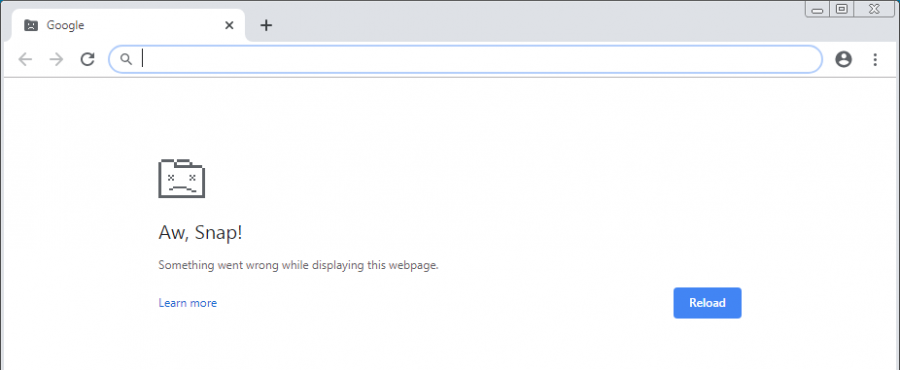
In this case, you can use the search conditions such as period, target (instance, business), minimum response time, advanced search conditions and so on to reduce the number of transactions viewed.
Then, in what cases, can we resolve issues by using the search conditions?
Q) I have been viewing the transaction distribution for several days and I want to know when the response time jumped up. But there are too many transactions, so I cannot see them all on one screen. Is there any way out of this?
A)Set the minimum response time to 0ms ~ 200ms and exclude fast transactions from the scope of searches. Focus your resources on monitoring transactions with slow response times.
Q) There is a customer who says they have been using the service monitored by Jennifer but they are the only ones who get slow services. I want to view the transaction distribution of that customer. Is there any way out of this?
A)) In the ‘Transaction search’ feature of ‘Advanced search condition’, use the customer’s ‘user ID’ or ‘Client’s IP address’ to check their response time distribution
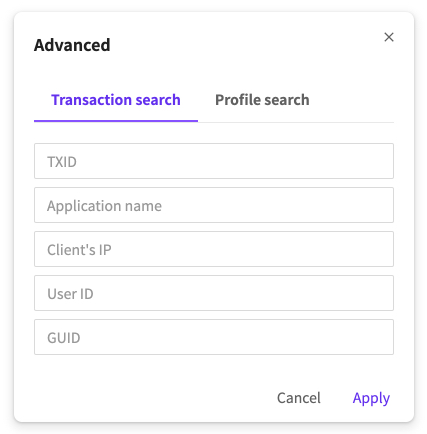
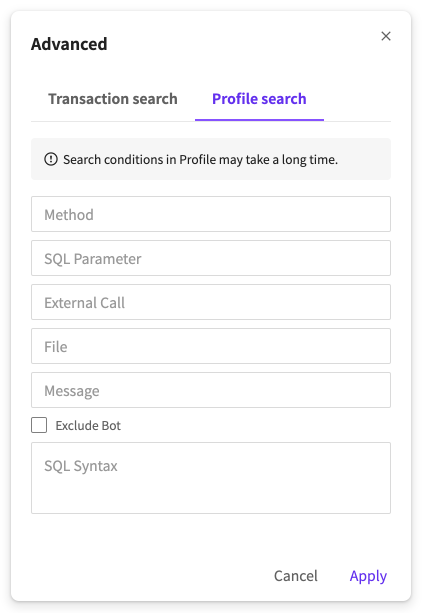
Q) ) I don’t think all the transactions are slow but the ones with specific SQL or external HTTP calls are slow. Is there any way to check the transaction of the traffic flow?
A)You can use the ‘Profile search’ function of advanced search condition to view them. In this search condition, there will be additional profile searches, so it might take a long time.
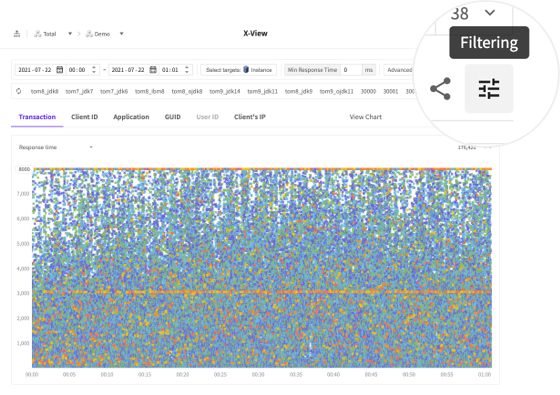
Transaction filtering,
Can support detailed analysis!
When viewing transactions, lots of data is sent to from the server, so, Jennifer provides the powerful filtering function to avoid repeated viewing of the same data. Use the transaction filtering function.
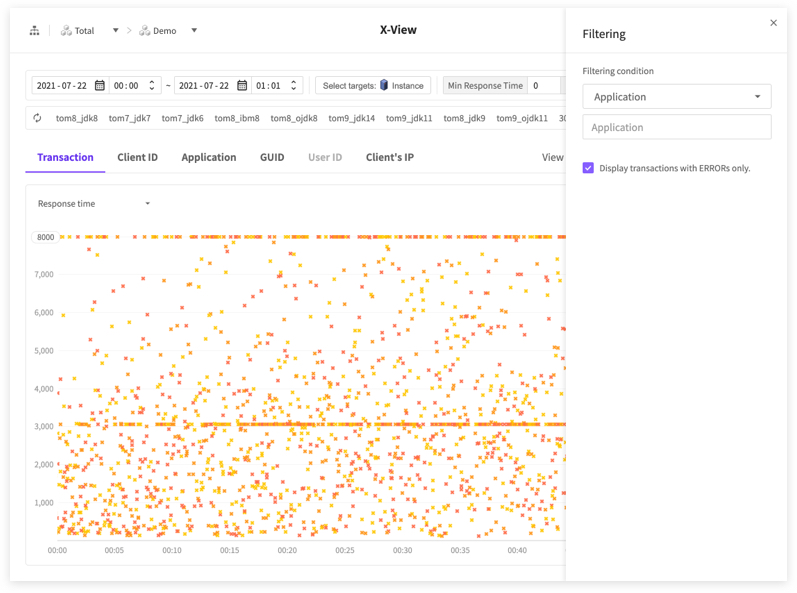
Filtering condition
Displays transactions with errors only
- Filters out transactions with no error and displays transactions with errors only.
Time
- Response time, SQL time, Fetch time and etc
Other conditions
- Application, excluded application, GUID, client’s IP address, user ID and so on
After selecting a condition, enter the value in the input menu, and press the ‘Enter’ key to add it.
If the ‘Time’ condition is used, then additional UI will appear to let you select a sign of inequality. You can use the toggle button to turn ‘On’/‘Off’ every condition after it is added.
You can also add the same type of filtering conditions. Multiple items are connected in ‘or’ conditions.
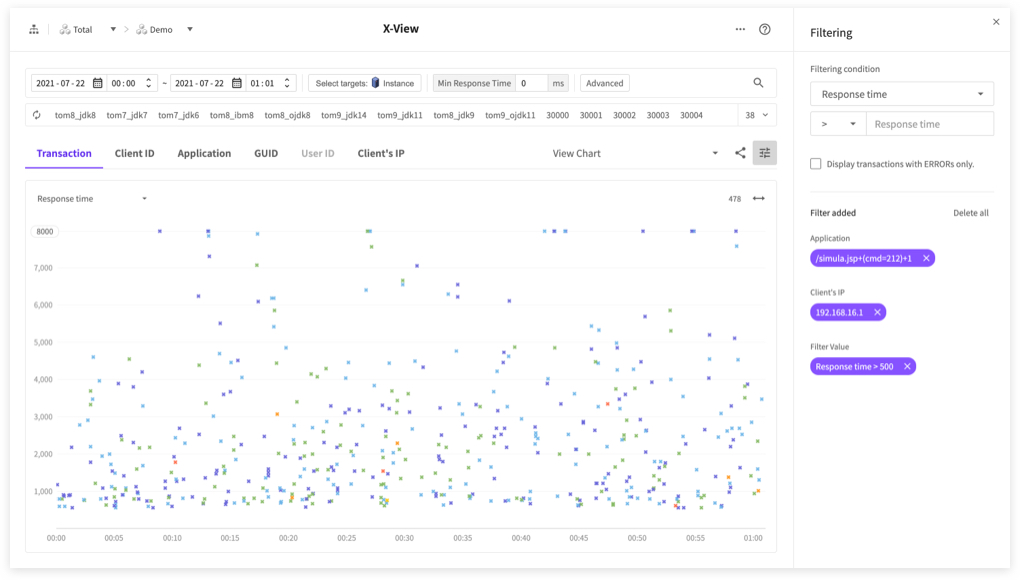
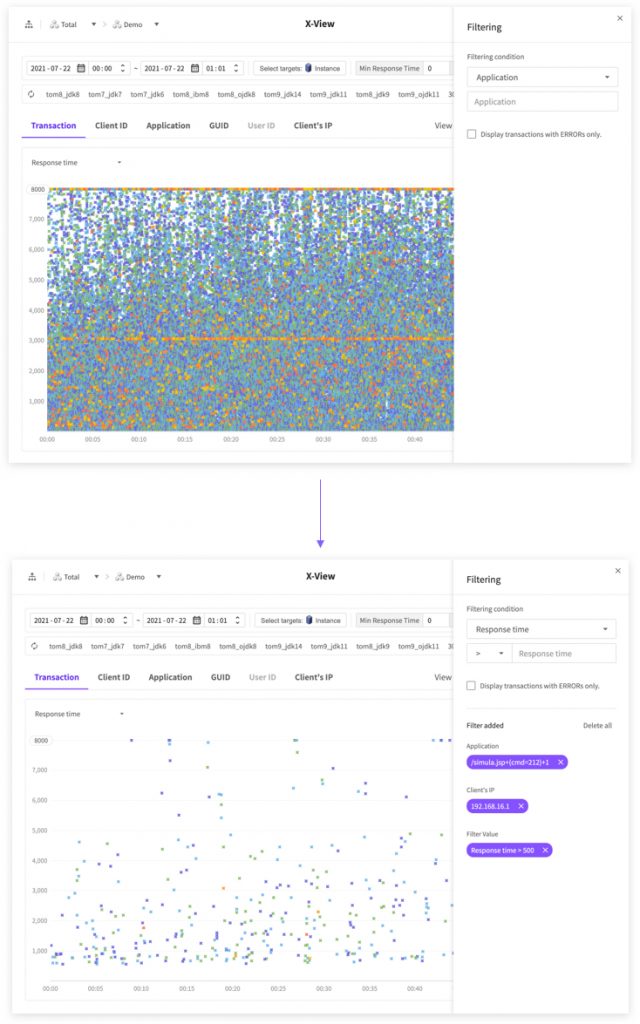
As shown in the figure, if two keywords, ‘/simula.jsp+3’ and ‘/simula.jsp+4’ are added in the application condition, then it will just return the transaction where application belongs to ‘/simula.jsp+3’ or ‘/simula.jsp+4’.
Different types of filtering conditions are connected in the ‘and’ conditions. As shown in the figure, if ‘Client’s IP address’ – ‘192.168.208.1’, ‘Response time > 500’ are added, then it will just return the transaction where the application belongs to ‘/simula.jsp+3’ or ‘/simula.jsp+4’ and ‘Client’s IP address’ is ‘192.168.208.1’ and the response time is above 500ms.
OK, how was the summary of the recently renewed X-view transaction analysis function? Next time, we will summarize the new changes made in the X-view pop-up function. See you later. 😊
