FEATURES
JENNIFER Features
As a way of managing the environment of web application server has been changed quickly today, Monitoring Web Application Server(JAVA, .NET, PHP) is getting more important. Web Application Server(JAVA, .NET, PHP) resides in between end-user and back-end system, so all of transactions go through the web application server zone. Monitoring and managing transaction being processed by this zone is the most effective way to build the stable web application system.
Individual Transaction Monitoring
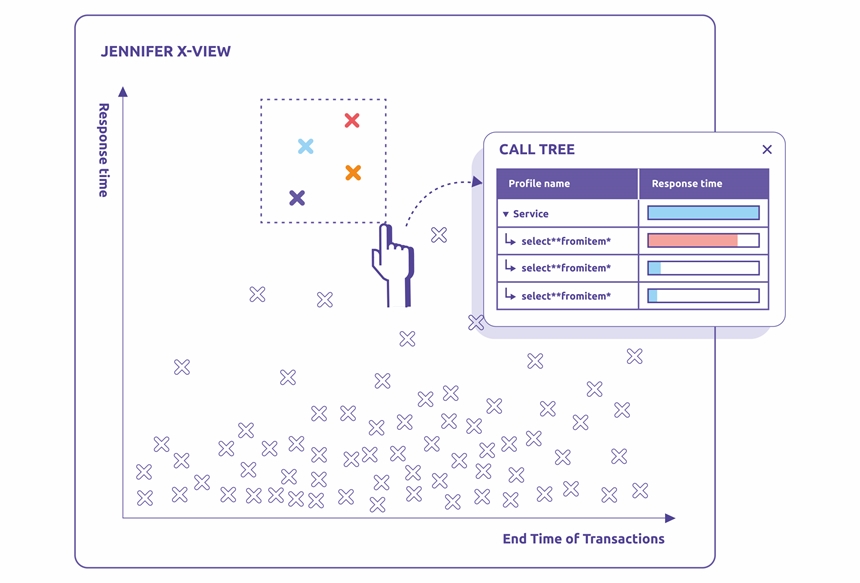
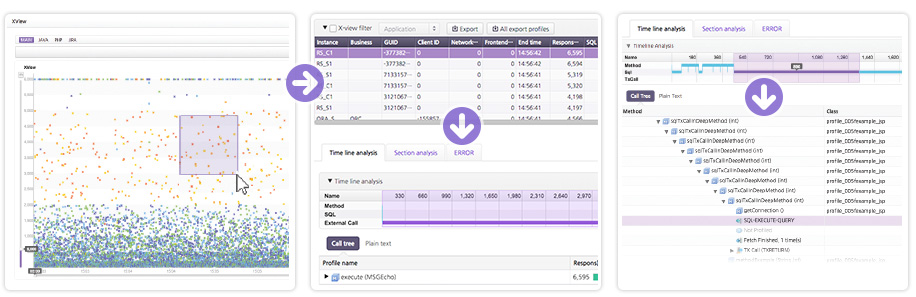
X-View allows you to monitor every transaction at once. You could easily find which point caused delay by using Smart Profiling.
Real-time X-View
X-View enables users to analyze closed transactions in real-time. X-View is a chart indicating the response time of all transactions as individual dots. Users are able to not only identify the distribution of response time of transactions, but also to detect various distribution patterns. As a result, they can recognize the cause of problems promptly and respond to them.
True Real-time Monitoring
You could monitor the status of Active Service and stack in real-time and analyze ever performance Metrics in seconds.
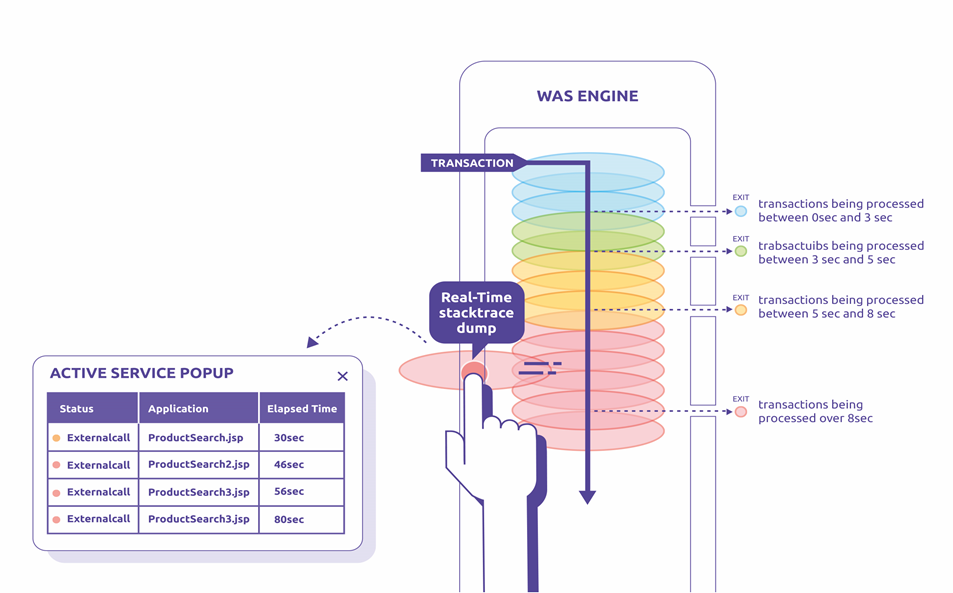
Real-time Active Service Monitoring
From all transactions that come into WAS for processing, Active Service Monitoring controls the entire process in real-time. Its intuitive chart shows meaningful information such as transaction execution status, including which transactions are not yet processed, which users are suffering response delay, and which SQL query is executing in real time
Per Second Analysis
The statistical data provides multiple resources you need for your system performance management including system resource usage pattern, application operating pattern, and problem rate pattern based on previous data. Quite many APM solutions, however, manage such important resources as statistic data.
To make the statistic data, the solution calculates the average. Because if all the raw data were saved, the software might not be able to process large capacity data. For this reason, many solutions provide the average of statistical data. But by doing so, one of the significant elements, Peak data, would not stand out from average. Whenever you analyze the historical data, you have no choice but to put up with data loss.
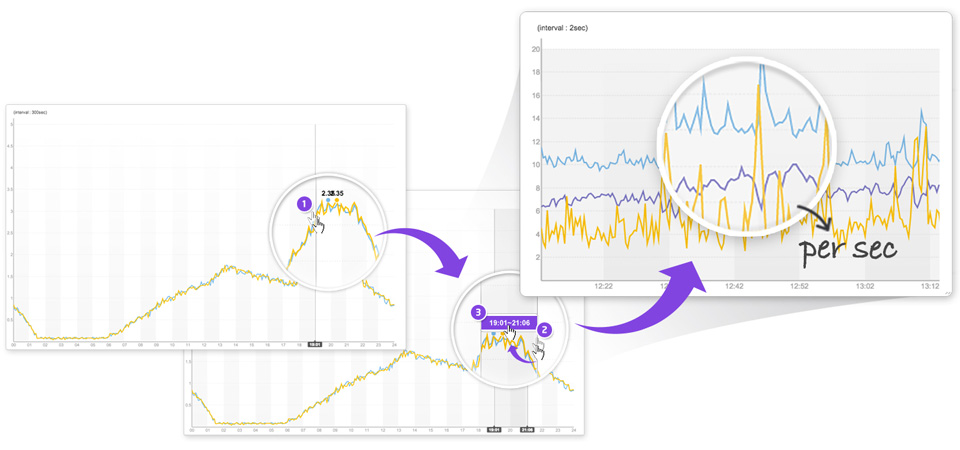
JENNIFER allows you to analyze the real-time data at the point of time you wish through its per Second Repository Processing Mechanism. You will be able to clearly analyze the root cause of deteriorating performance or simply the cause of error.
Real-time Dashboard & Topology View
Role-Based Dashboard help each user choose dashboard they would like to monitor. With real-time Topology View, you could initiate the real-time monitoring on connected areas around web service.
Role-Based Dashboard View
Web system monitoring is the main focus for administrators who manage business, cloud, and large-scale systems. Business administrators should monitor performance from different perspectives: whether their business processes are running properly and whether their customers are satisfied with the business processing. For that reason, JENNIFER provides a role-based dashboard view to help users easily understand the relationships between the various performance monitoring tasks required for web systems.
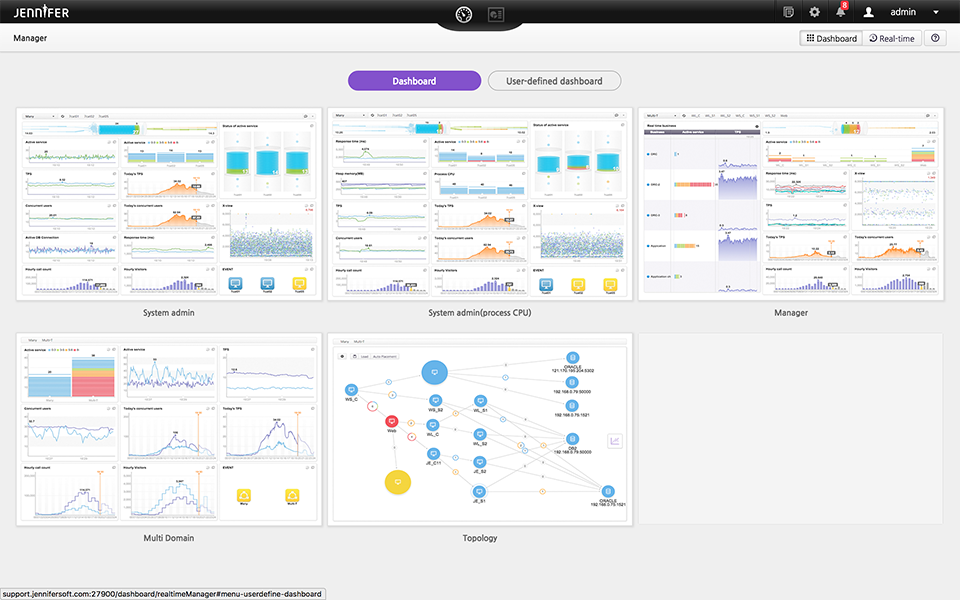
Dashboard
JENNIFER dashboards are categorized as either system administrator, manager, or multi-domain integrated dashboards. This determines the core monitoring methods on offer. Non-professionals are presented with information and features that they can easily understand.
Manager Dashboard
Multi-domain Dashboard
Web Service Real-Time Topology View
The JENNIFER application topology view maps the layout of mission-critical applications in an enterprise, how different apps are connected to each other, how they can be accessed by various computers and networks, and how they are currently performing in terms of efficiency and availability. By clearly visualizing how different parts of a system are interacting with one another, a system administrator can better understand how each component affects overall performance.
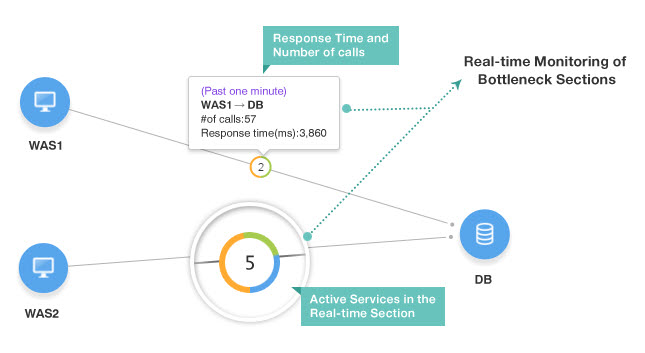
Real-time Monitoring of Bottleneck Sections
Using active service data for subsystems and response time data, it is possible to intuitively monitor the locations of bottlenecks. For example, it is possible to monitor whether load balancing is achieved by database (DB) dualization. This enables you to head off faults before they happen.
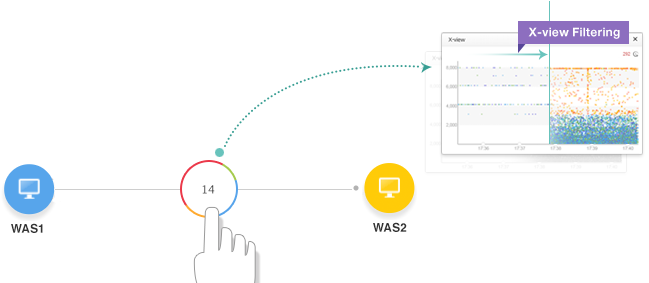
Analysis of Response Time Distribution (X-View) for All Transactions Executed in a Subsystem
It is possible to intuitively analyze all transactions executed in a subsystem through X-View.
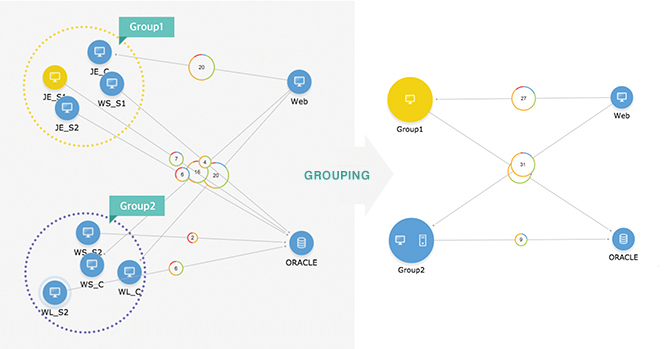
Monitoring of Large-scale Sites by Grouping
Large-scale Web systems use a lot of instances to execute the same service. It is possible to monitor the instances through real-time grouping.
Cloud Environment Support
JENNIFER also provides Auto Scaling feature under the Cloud environment. Based on expandable architecture, JENNIFER allows you to run integrate monitoring on large capacity service.
Cloud computing is revolutionizing how IT resources are used and managed. Administrators can now setup or take-down virtual servers in minutes as needed – also the applications that run on them. To really benefit from a cloud environment, the flexibility and convenience that it offers in terms of hardware resourcing has to be matched in the application deployment and performance management space. JENNIFER provides the following three features, which support application performance monitoring in a cloud environment.
- Automated detection of system expansion
- A dashboard for the service (domain) perspective.
- Integrated agent management (deployment and upgrading of JENNIFER agents
JENNIFER allows you to monitor the increase and decrease of instance in real-time from the point of constitution. If the instance does not increase while the active service is increasing, you will be able to control remarkably increasing traffic by applying Auto Scaling.
JENNIFER Repository(BIG DATA Processing and Analysis)
The JENNIFER repository is designed to support flexible expansion of architectures. Users get all the benefits of big data analysis but there are no unnecessary costs when it comes to system expansion.
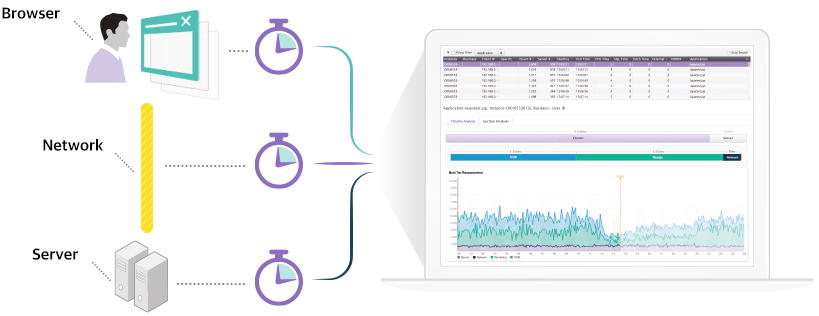
Web Service Real-User Monitoring
The performance of a web service is no longer measured in terms of hardware and software usage alone. Customer satisfaction is fast becoming a key performance indicator across virtually all industries, and web services are not immune to this movement. Companies are looking to monitor accurately what customers are experiencing when they use the services, so that they can make improvements to the process and achieve higher levels of customer satisfaction. To answer this need, JENNIFER now offers a real-user monitoring (RUM) feature. JENNIFER measures transaction response time from browser to server, providing a detailed analysis of the application’s performance as it traces a user activity path employing the web service.
PLC(Peak Load Control)
By using PLC, you could control the level of service load through user-defined threshold. The PLC is built upon real-time active service monitoring of JENNIFER. The feature would prevent the possibility of shutting down your entire system due to unexpected explosion of user (for instance, course application at school, ticket reservation service or events at shopping mall.) Users can choose necessary service they need to maintain the level of threshold. They could run relatively important service or limit the use of service that is not important when threshold reached the limit users defined.
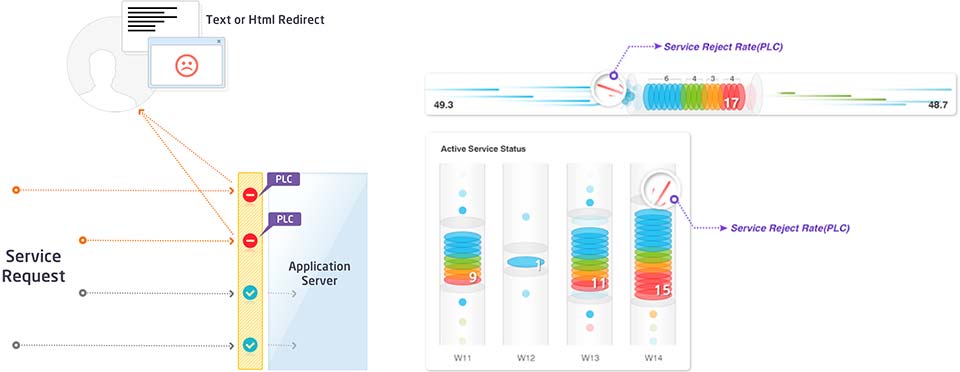
Once PLC is activated, it would send the message of reason why related request was not processed to users who could not use service by their browsers.
- Display defined text message
- Redirect to defined HTML page
When PLC is activated above the level of threshold, users could monitor on-going status in real-time through the speed meter of dashboard.
