JENNIFER Kubenetes
What is Kubernetes?
Kubernetes, which is called ‘K8s’ in short, is an open source that has become a practical standard for container orchestration.
As of now, over 5.6 million developers around the world use Kubernetes, which is equivalent to 31% of all back-end developers.
Concept of Kubernetes
Kubernetes is a tool that executes and orchestrates applications (containers) in multiple machines (nodes) to maximize the strengths of the Linux container.
Its purpose is to provide a platform for automating application container arrangement, scaling, and operation among multiple clusters.
Change of Monitoring Perspective in the Kubernetes Environment
In the Kubernetes environment, the application unit becomes smaller and the target of monitoring is not continuous, therefore, many dynamic changes occur.
As it provides services by being dispersed to numerous workloads, if there is no appropriate context for the matrix being collected, it may be difficult to associate it with a failed process and applications having such problems.
Why Kubernetes Must be Monitored
The basic components of a cluster can have a direct impact on application performance.
Therefore, it is necessary to conduct monitoring by integrating the Kubernetes-based application service monitoring with APM.
This is because integrated monitoring makes it easy to identify what impact the infrastructure has on the application service, and makes it possible to respond quickly in the case of issues.
JENNIFER Kubernetes Monitoring
In the case of application services, it must be possible to differentiate all elements related to the service and monitor the performance information. This function becomes even more important when service is distributed by composing workloads in multiple clusters.
JENNIFER Kubernetes Monitoring facilitates easy identification of the impact of Kubernetes infrastructure performance on an application.
JENNIFER added the APM-Kubernetes monitoring function in its latest version (5.6.1.1).
If the application is operated in the Kubernetes container, Kubernetes infrastructure and application performance information are collected simultaneously and are displayed in the real-time performance monitoring dashboard.
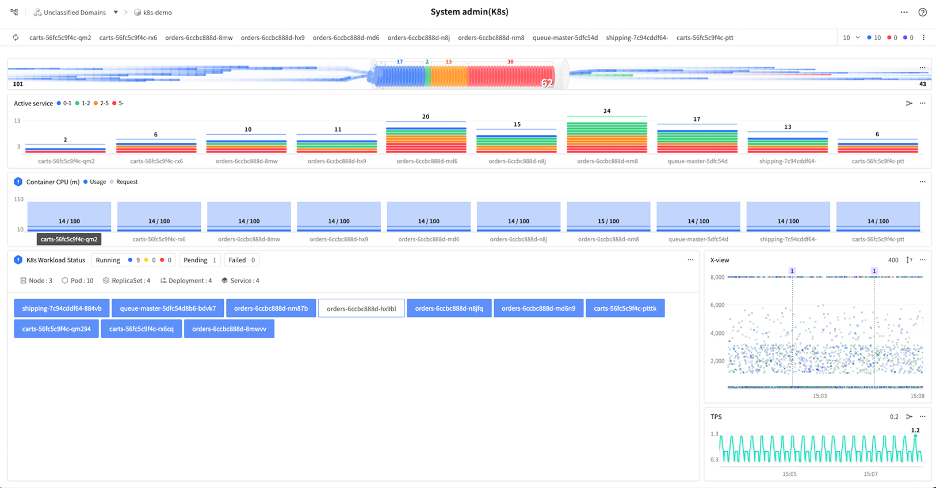
The JENNIFER Kubernetes System Admin dashboard is a dashboard provided for the real-time reading of the container resource status that services application transactions and applications.
The system admin dashboard (K8s) can be used to identify the application service and container resource usage status, as well as the dynamic changes of various workloads (Replicates, Deployment, Service, etc.).
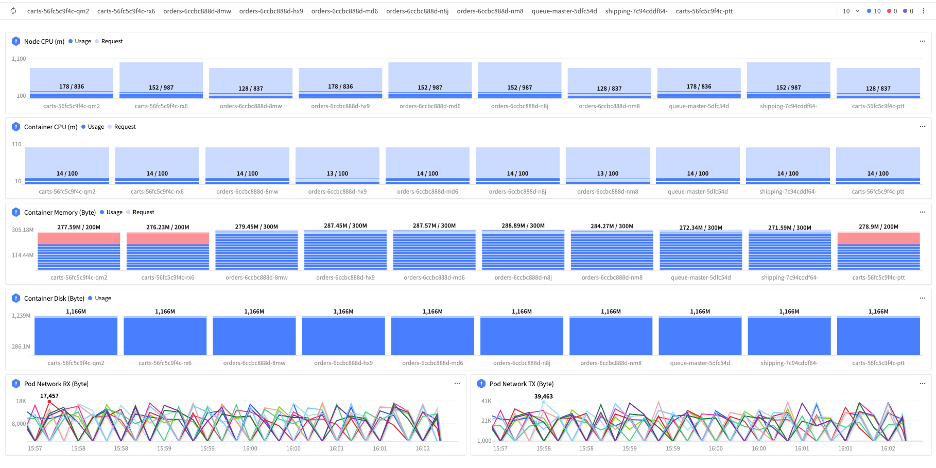
The JENNIFER Kubernetes System Resource dashboard makes it possible to compare the resource usage of the Kubernetes components (Node CPU, Container CPU, Memory, Disk, Network Usage) operated by the application.
As it is possible to check whether resources were allotted at the amount request, or whether it is being used in the appropriate resource range by comparing with other resource data, it is easy to identify the container resource operation status.


By selecting each node or container, the node and container details, event details, metadata (YMAL), and log history can be checked in real-time, thereby helping to identify the elements that affect the application.
Coming soon, JENNIFER Kubernetes (K8s)
JENNIFER currently offers APM-K8s performance information focusing on the container that provides application services.
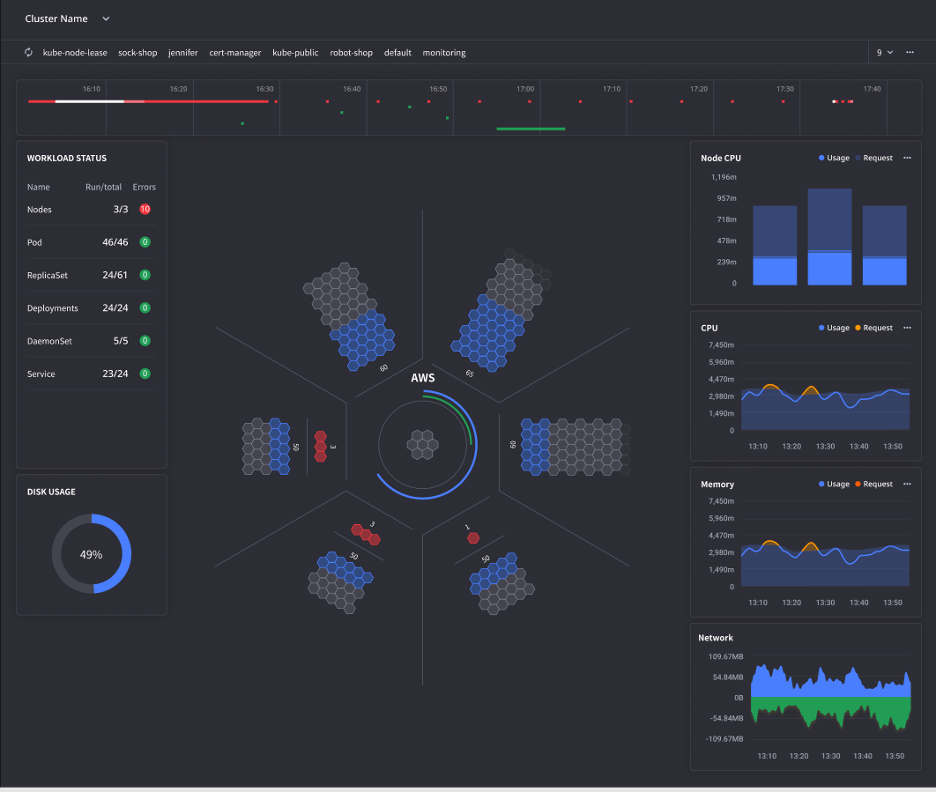
JENNIFER-K8s that will soon be released will be upgraded to a comprehensive K8s monitoring solution that provides real-time monitoring and various analysis information for all Kubernetes components.
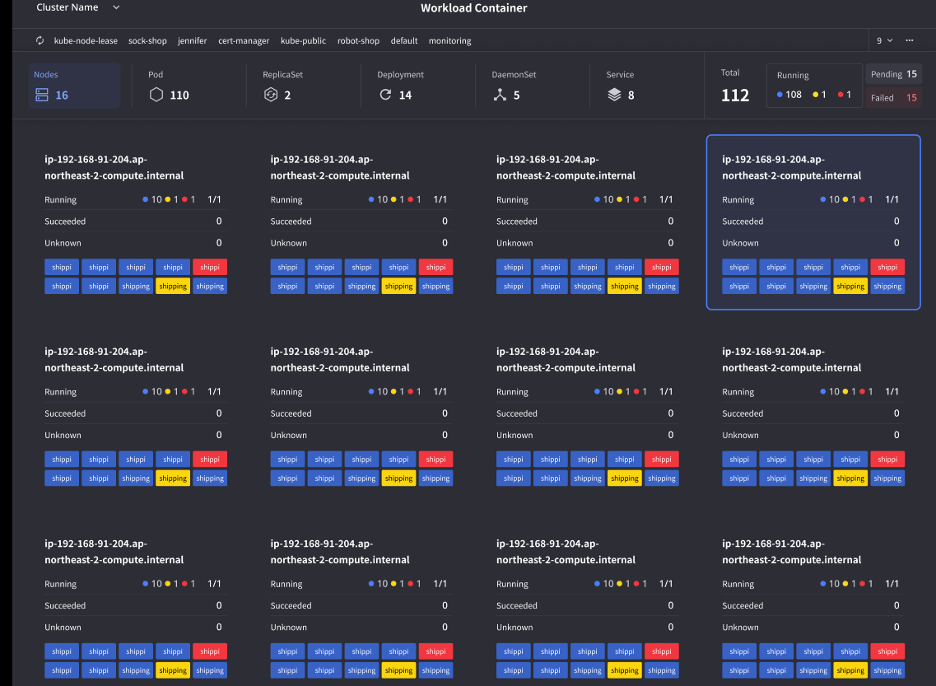
It comprehensively monitors various workloads status information, dynamic change information, status change, etc. composed within the cluster.
It will offer a dedicated Kubernetes infrastructure dashboard and a range of analysis functions that can easily identify the impact of components.
It includes a dashboard that can view various workloads by groups according to their features, as well as a new UI for directly checking resource usage of CPU, Memory, Network, Storage, etc. that can affect services in each group view.
And using the upgraded JENNIFER APM and integrated functions, all APM-K8s information can be accessed from a single dashboard.
By linking performance matrices, error events, and logs that occur in each component of Kubernetes, it is possible to check the exact relevant data and easily identify elements that affect application performance through an integrated UI.
