Stacktrace Sampling Based Performance Analysis – SFR (Stacktrace Flight Recorder)

Since we improved the Java performance by using the stacktrace analysis function for individual transactions introduced in https://jennifersoft.com/ko/blog/tech/2021-10-18/ last time, Jira has been still maintaining a high speed without a single restart (So, unfortunately, we don’t have a chance to use the latest version of Jira. hahaha).
Now, we are back with the function that can help our entire application performance analysis a little bit.
A story about developer Y starting his own hard struggle to resolve performance issues that cannot be done with individual transaction analysis.
Let’s begin now!
Prologue
A very peaceful day as usual. Developer Y was still working on APM collection server stuff.
But, he learned that similar types of issues are recently registered in Jira.
The following stuff is displayed on the log of the collection server and the dashboard does not display any data.
server.data.2022-04-14.log:2022-04-14 15:33:04.833 KST [:ME:CommandFromViewServerProcessor] WARN  c.a.d.n.CommandFromViewServerHandler - Request from view takes much time to finish. request=CommandRequest(key=520:70,bodyLength=94), finish=350/1000, wait=0, process=350<br>
server.data.2022-04-14.log:2022-04-14 15:33:04.990 KST [:ME:CommandFromViewServerProcessor] WARN  c.a.d.n.CommandFromViewServerHandler - Request from view takes much time to finish. request=CommandRequest(key=520:70,bodyLength=94), finish=300/1000, wait=0, process=300<br>
server.data.2022-04-14.log:2022-04-14 15:33:08.186 KST [:ME:CommandFromViewServerProcessor] WARN  c.a.d.n.CommandFromViewServerHandler - Request from view takes much time to finish. request=CommandRequest(key=520:70,bodyLength=136), finish=401/1000, wait=0, process=401<br>
server.data.2022-04-14.log:2022-04-14 15:33:08.701 KST [:ME:CommandFromViewServerProcessor] WARN  c.a.d.n.CommandFromViewServerHandler - Request from view takes much time to finish. request=CommandRequest(key=520:70,bodyLength=136), finish=294/1000, wait=0, process=294<br>
server.data.2022-04-14.log:2022-04-14 16:28:02.497 KST [:ME:CommandFromViewServerProcessor] WARN  c.a.d.n.CommandFromViewServerHandler - Request from view takes much time to finish. request=CommandRequest(key=520:70,bodyLength=94), finish=300/1000, wait=0, process=300
According to our simple analysis, each request is supposed to be processed within 1 second, but it only takes from 0.2 to 0.4 seconds.
Wait a minute.. Not even one second, but it finishes the performance improvement in 0.x seconds. Is this possible?
He decided to use the function to analyze the stacktrace collected on the basis of transactions that we used last time.
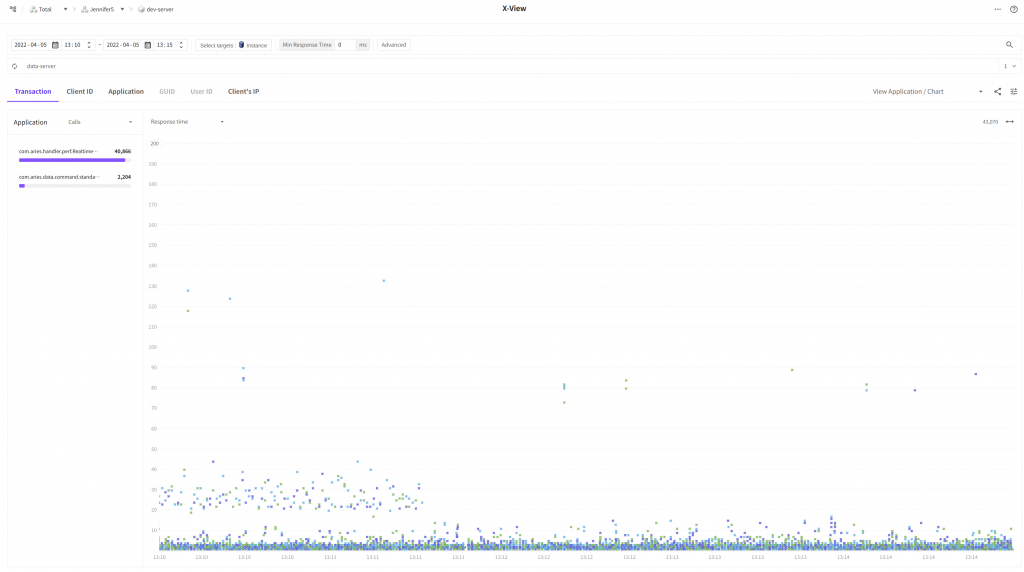
Well, most of the transactions are processed in less than 1 second.
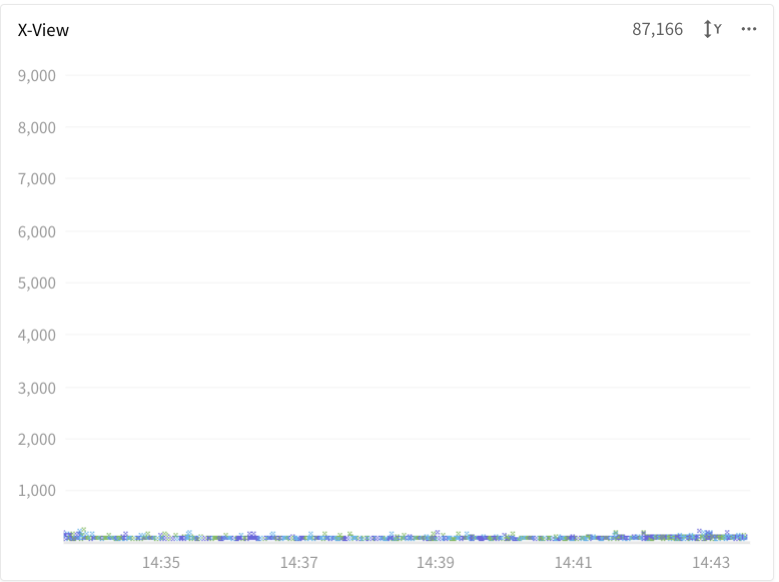
He adjusted the Y-axis of X-view chart to a smaller scale and found out some transactions collected in the stacktrace.
He checked that since the collection server is processing TCP requests, not web requests, individual transactions are finished in a very short time period.
However, just with the stacktrace information collected for each transaction, he couldn’t even get a clue as to how performance can be improved, so He did not know what to do.
After some thoughts, he recalled that the previous developer inserted a function to call methods somewhere there, right? He quickly activated the option and checked the log.
Preparation for the new stacktrace analysis function
Instead of individual transactions, we needed to view the sampling results throughout the entire application, so unlike before, we had no entry point such as in X-view, so we needed a new analysis screen.
The following goals are set for the analysis function to supplement the disadvantages of the sampling function displayed in the existing log.
- Enabling speedy viewing over a daily range (make it quick..)
- Being able to use in an easy way without going through complicated settings (developer does not like tedious things..)
- Minimizing the impacts on agents and collection servers (We shouldn’t have trouble because we use it?)
- Being able to intuitively assess the relations of method calls to look for (Time is money..)
The initial two required components are selected as follows.
- Statistics of methods being called during the stacktrace method collection period (afterward, we call this top method.)
- FlameGraph based on the stacktrace called from the viewing range
Ah.. Now, we thought there can be many stacktraces subject to analysis unlike before. In the past, it is the stacktrace information about a single transaction, but now it is the stacktrace information collected from everywhere, that is why.
“Instead of adjusting the minute- based viewing range that was no good, isn’t there a better way?”
Developer Y carefully browsed through the FlameGraph related articles, and found FlameScope(https://netflixtechblog.com/netflix-flamescope-a57ca19d47bb).
Well, it is about the visualization method developed by the developer of FlameGraph.
To put is simply, it is a heatmap chart that displays the data collected in a small time scale by applying a different level of darkness of colors in proportion to the number of data sets. It differs from general heatmaps in that both X-axis and Y-axis represent time, so it is possible to express the varying pattern depending on time flows.
Oh, yes. Now, we can use this to adjust the range when viewing large-size data. Maybe, we see that pattern, we can even assess the status of the application as well, right?
Now, we have selected 3 items for the new analysis screen.
Besides assessing the application status from the pattern, since it is a chart that shows the time flows, we can drag the range and set the viewing range of massive stacktrace information.
- FlameScope
- Top Method
- FlameGraph
I will introduce you to further details of each item once the analysis screen is completed.
About after 3 months…
After heated debates among front-end developers, and designers, now the new analysis function is completed.
The name of the function was chosen through internal ballots finally as SFR (Stacktrace Flight Recorder). It means that the stacktrace information is gradually recorded without knowing as the application operates.
I think stacktrace information recorded at all times can greatly help you in assessing the cause of unexpected troubles.
Let me introduce you to SFR.
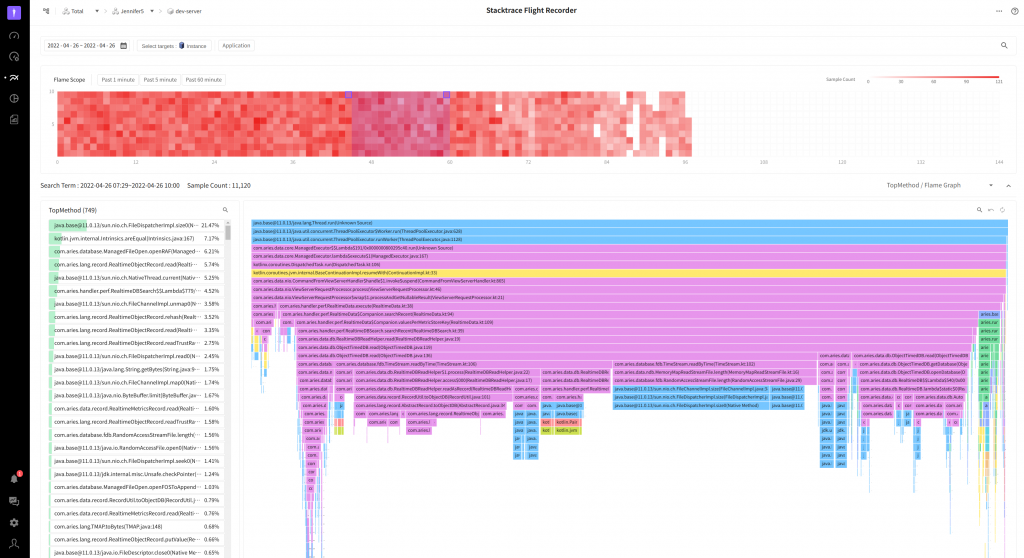
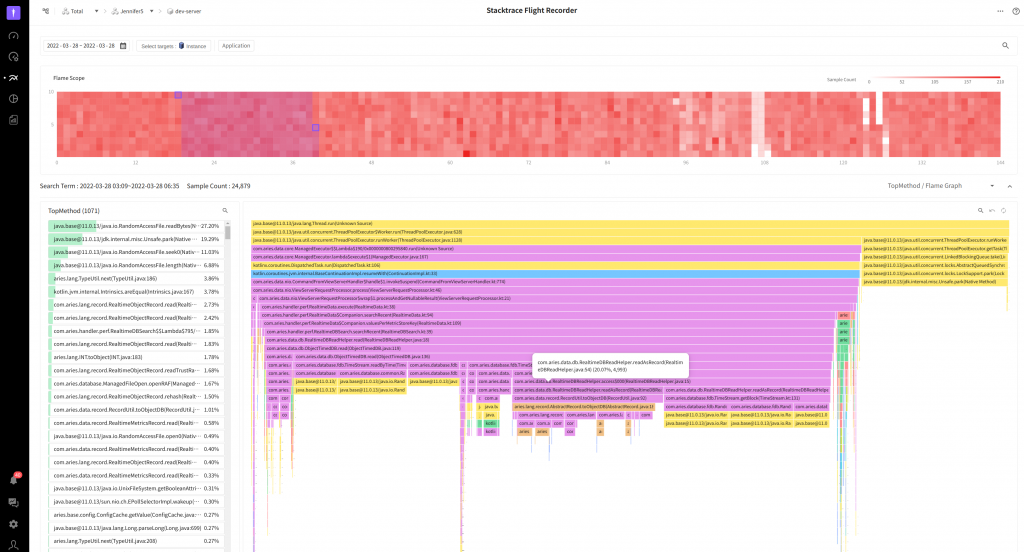
Intended use and purpose of a component
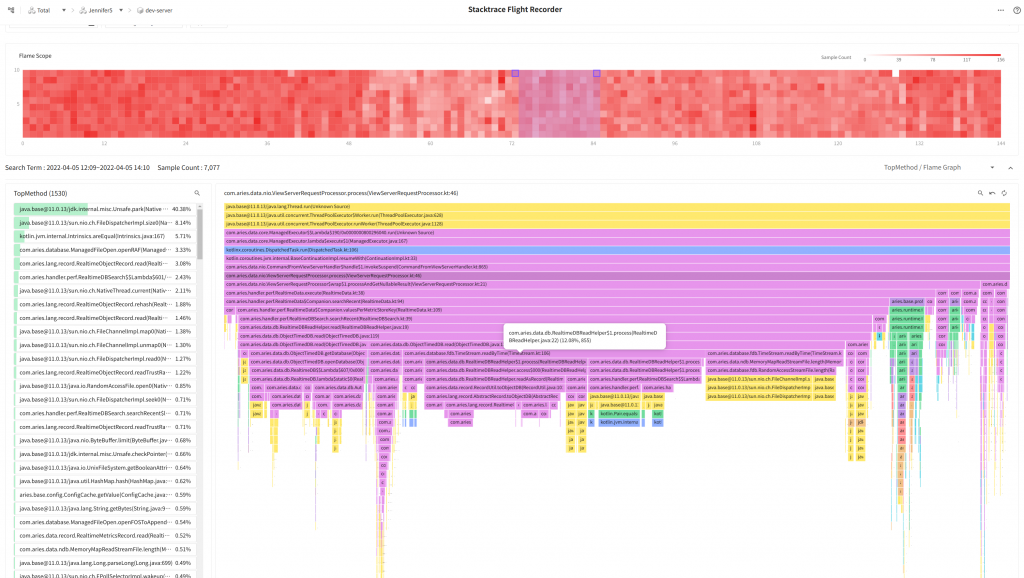
As shown in the above image attached, SFR is mainly composed of three components.
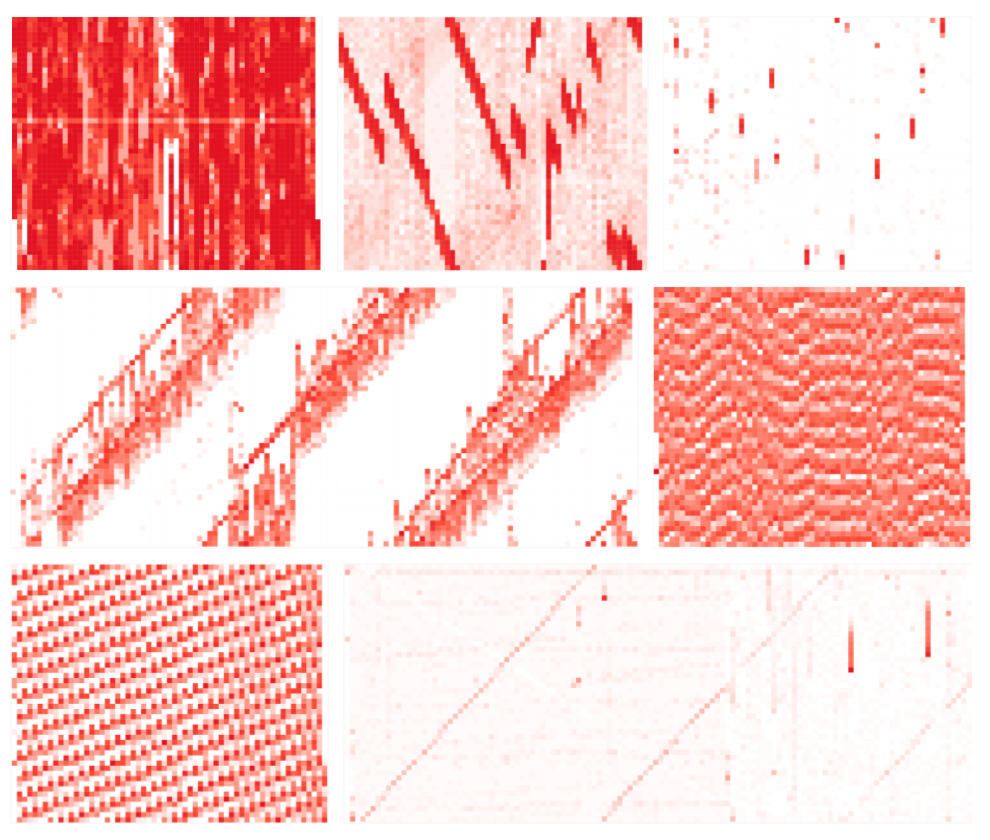
- FlameScope
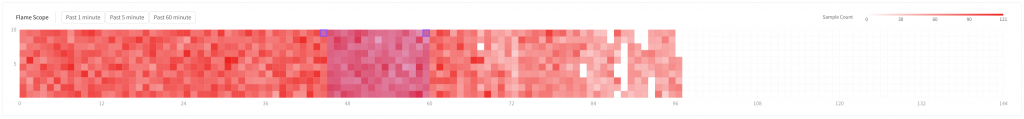
It is a chart with lots of squares in reddish color. Each square means a time duration of 1 minute and the more the collected stacktrace there is the more red color it gets.
FlameScope mainly serves two purposes.
- TopMethod, FlameGraph viewing range selection
We wanted to see the changes when viewing it on a daily scale, so we set the max viewing period to 7 days, If we view all the data pertaining to this period, then we won’t be able to satisfy users with slow viewing speed? The more red color it gets the greater amount of stacktrace is collected due to some reasons. Generally, this is where the user needs to check. Since collection frequency in the unit of minute based on FlameScope is displayed, it is possible to reduce the time section required for a user’s analysis (It is a similar relation to the X-view chart used to check the profile).
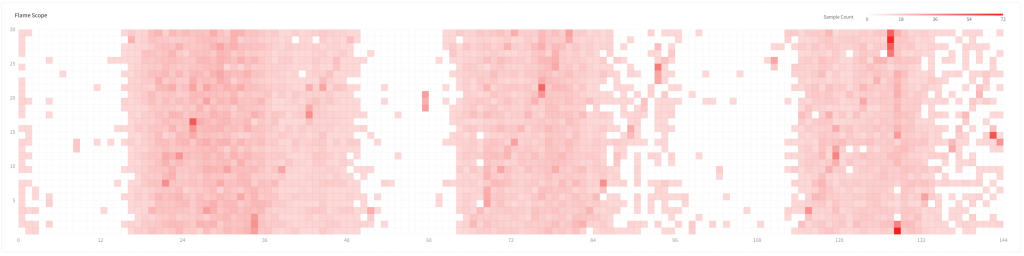
- Prediction of application characteristics and status based on the pattern displayed on the heatmap chart
In the above, as we described in the FlameGraph selection process, we can show a certain status of an application. We can see some of the patterns running periodically with a time interval, where loads are concentrated in a specific time at the company.
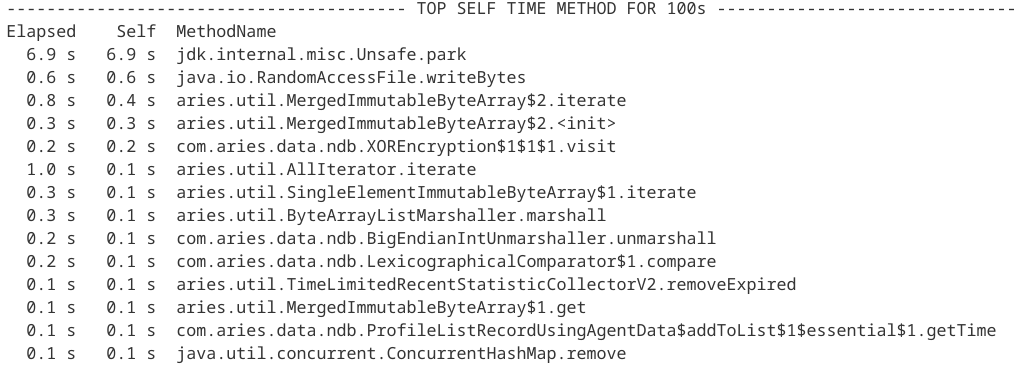
2 TopMethod
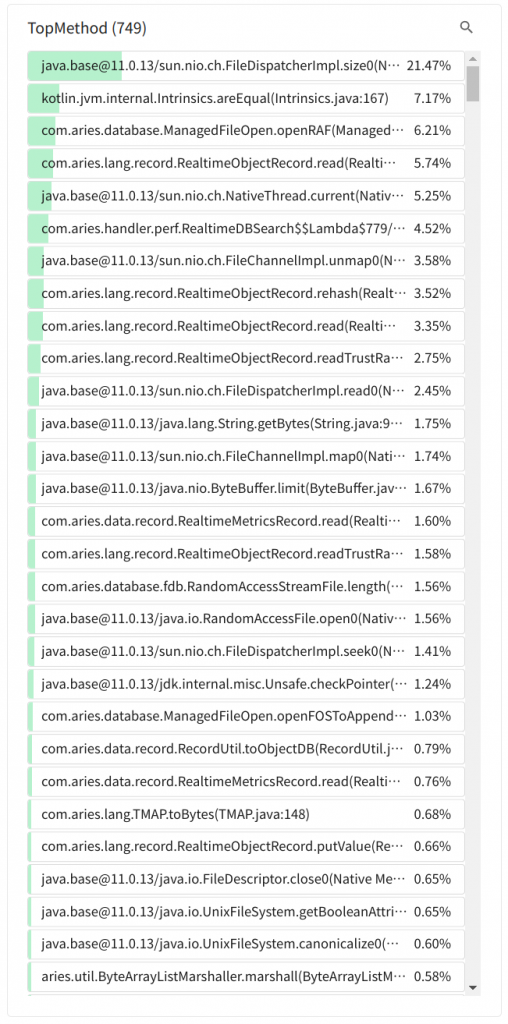
It represents the distribution of calls for the method running at the time of stacktrace collection.
If there is a method created by the user at the top, then the method is likely to be in the bottleneck point. In the above screenshot, the FileDispatcherImpl.size0 method that measures the file size is most frequently called.
Using the method to cache the previously measure file size, you can reduce the frequency of method appearance and during that time, you can acquire time for running new methods. It can in turn lead to an improvement in the application performance.
This is the most useful part when using the log-based method sampling analysis function in the past, and here we can repeatedly find the method call areas and make an improvement.
But here is an issue. To look for the method appearing here, we had to spend lots of time using IDE to look for called methods. But if the method is called at several other places, then it would be even more tedious, right? (It would have been impossible without IDE.)
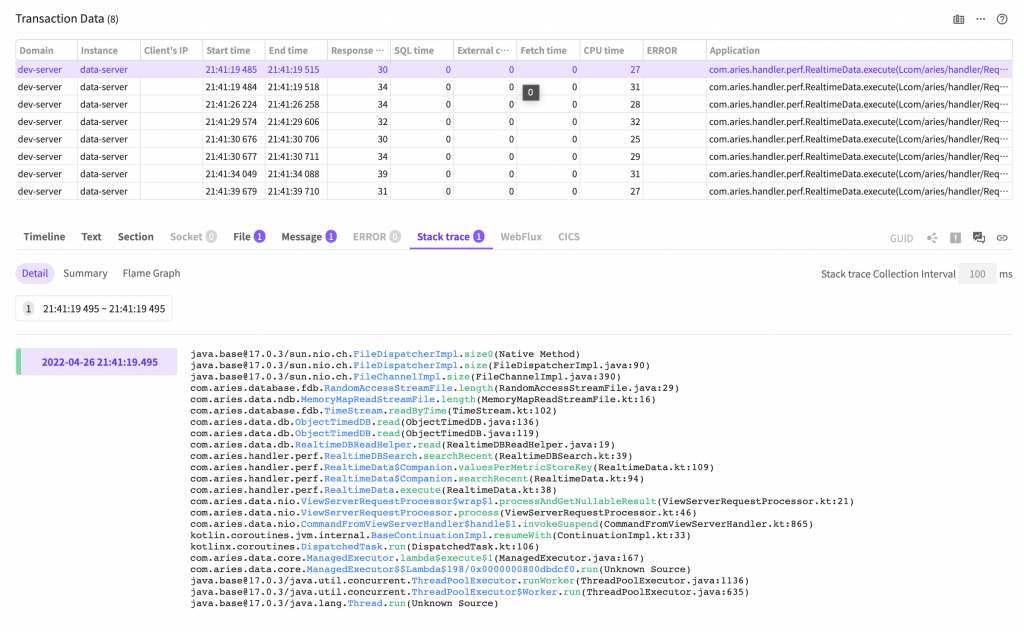
3.FlameGraph
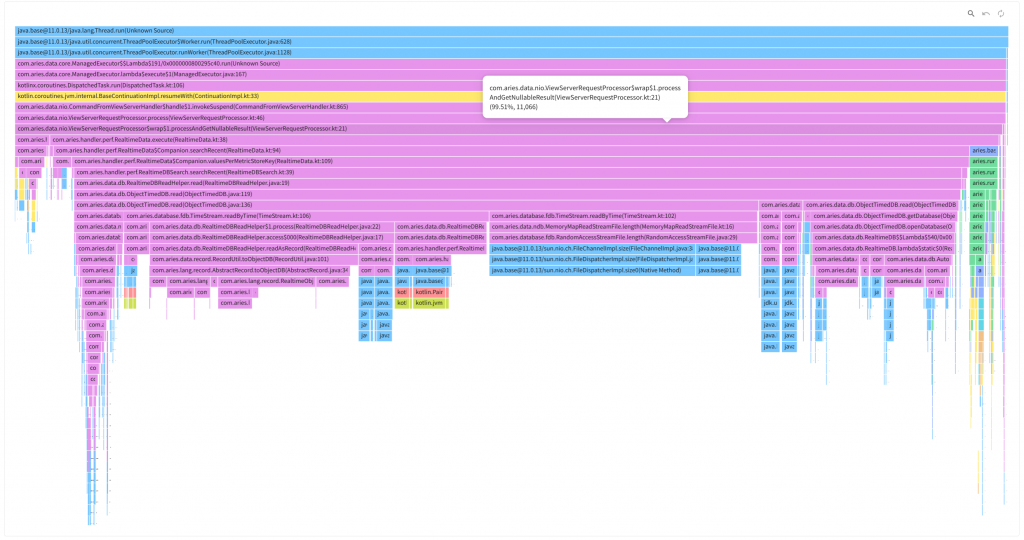
It is the soul savior who rescued me from the boring job of looking for method locations in TopMethod. Here, as opposed to the previous case, we use an upside down FlameGraph.
Generally, it is called Inverted FlameGraph or Icicle Graph. The size shrinks from top to bottom, and it looks like an iceberg, so they named it that way. At the top of the graph, there is the start point of stacktrace and as you go down, the more recently executed method will be found.
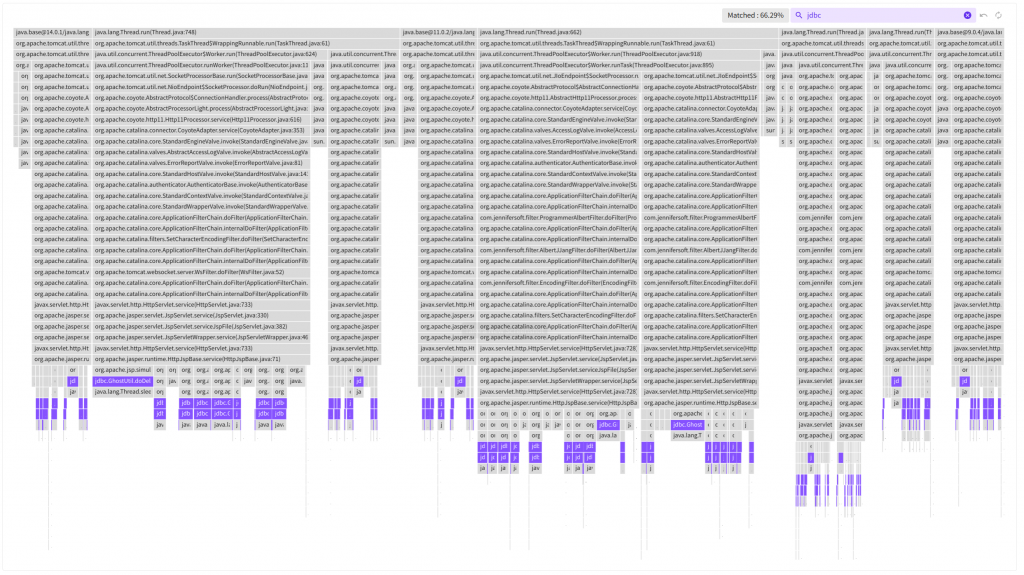
Let’s assume that the user who wants to express the original FlameGraph instead of the above chart has a monitor with a low resolution. Maybe, it is highly likely that only chopstick-like sections will be displayed. A user who sees it for the first time will be perplexed (Moreover, in this case, the method name is not even displayed).
We thought if we use Inverted FlameGraph, at least, the top area will be the start area of the call stack, so, it would be easier for users to recognize it. And the self method can be immediately checked in TopMethod on the left.
Since it is possible to click a line of TopMethod on the left or enter search keywords, we can emphasize the location of the method in FlameGraph, so we can easily check the frequently called method and its location.
Now, we have discussed the components of SFR.
Now, let’s use SFR on our own to improve the performance of the app with slow response time as developer Y did and see if it is really effective, shall we?
What is the problem?
APM dashboard displays data that is saved every second for each type of chart and target of collection. Therefore, the more the monitoring targets are the slower the viewing speed gets.
Users are recommended to maintain a proper number of monitoring targets, but this cannot be forced upon them.
No matter how fast individual viewing is, as it is directly related to the disk I/O, parallel viewing attempts can force most of threats to go into processing at the same time, thus requests made afterward go into standby mode.
2022-03-30 00:00:03.979 [:ME:CommandFromViewServerProcessor] WARN  c.a.d.n.CommandFromViewServerHandler - Request from view takes much time to finish. request=CommandRequest(key=520:70,bodyLength=4258), finish=750/1000, wait=717, process=32
 2022-03-30 00:00:04.002 [:ME:CommandFromViewServerProcessor] WARN  c.a.d.n.CommandFromViewServerHandler - Request from view takes much time to finish. request=CommandRequest(key=520:70,bodyLength=2098), finish=783/1000, wait=717, process=65
Although the processing time is low, we can see that the waiting time is very long. If you want to reduce the waiting time, then you can make the small task processing time even shorter.
Even of you don’t comply with the recommendation, a certain degree of usability shall be guaranteed, thus let’s try to accurately assess the bottleneck point and improve the response time.
First, we installed an APM agent on the collection server and viewed the data collected for the day.
We dragged the red area of FlameScope, and found out that most of the processing time was spent reading RandomAccessFile based on the content displayed in TopMethod. The cause might be consistent attempts to read the file.
Improvement attempts – 1
Most of the time is spent reading the file, so how can we make it faster?
We can also apply memory-mapped file implementation methods to Java to enable us to directly map a file to memory and read/write, but there are some areas we should be careful with, so let’s take a look at other aspects.
Here, the pink area is the widest area, and you will see the AbstractRecord.toObjectDB part in the middle that stands out.
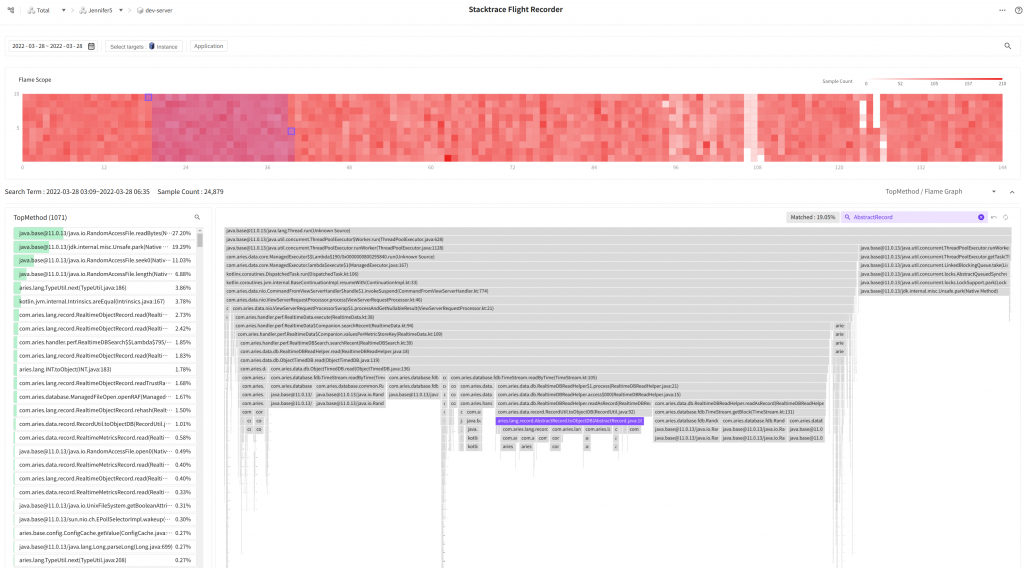
The lower-ranked methods use RealtimeObjectRecord.read to read in bytes from InputStream in the correct order to convert them to objects.
This part accounts for a total of 19.05%, so, if we make this one go faster, then we might be able to improve the performance a little bit.
protected IRecord read(InputStream in, boolean db) {
    if (!db) {
        this.time = TcpUtil.getlong(in);
    }

    this.otype = TcpUtil.getbyte(in);
    this.oid = TcpUtil.getint(in);
    int count = TcpUtil.getshort(in);

    for (int t = 0; t < count; t++) {
        short key = TcpUtil.getshort(in);
        TYPE value = TypeUtil.next(in);
        this.putValue(key, value);
    }

    readTrustRangePart(count, in);
    return this;
}
“There is nothing special to improve, isn’t it a good idea to use the byte buffer of NIO? If we use memory maps, then we can skip the conversion phase in the middle..“
Since it is easier to handle bytes and it is more convenient, so we opted for ByteBuffer.
@Override
public IRecord read(ByteBuffer bb, boolean db) {
    if (!db) {
        this.time = bb.getLong();
    }

    this.otype = bb.get();
    this.oid = bb.getInt();
    int count = bb.getShort();

    for (int t = 0; t < count; t++) {
        short key = bb.getShort();
        TYPE value = TypeUtilV2.next(bb);
        this.putValue(key, value);
    }

    return this;
}
Shall we apply the code changes and check the viewed results again?
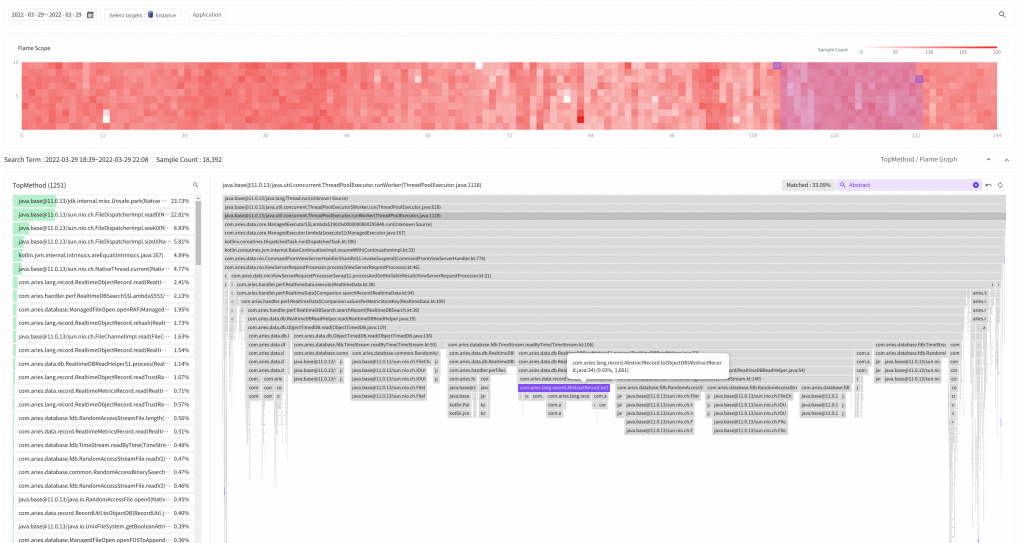
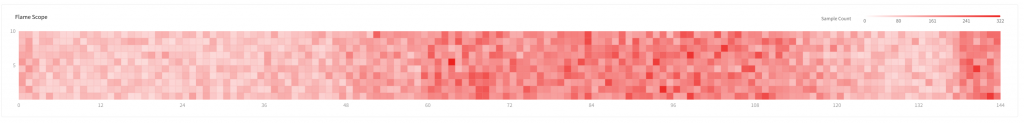
Well.. First of all, the color of FlameScope became thinner than before.
It means that the time to execute a task in the thread became shorter.
At the bottom FlameGraph, you can see that AbstractRecord.toObjectDB accounts for 9.03%. It is just a number, but about 10% of call frequency is reduced!
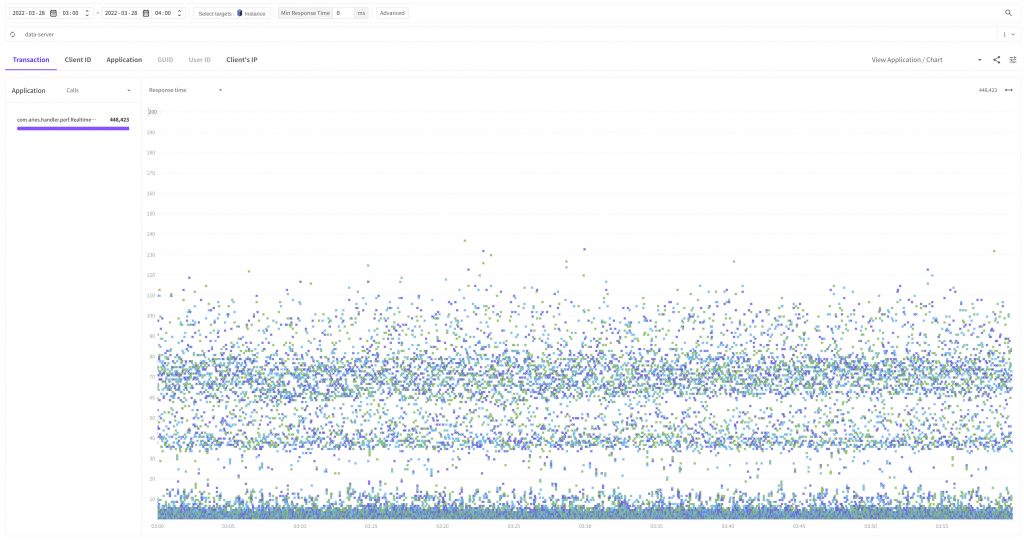
How about comparing it with the X-View chart?
- Before improvment
- After improvment
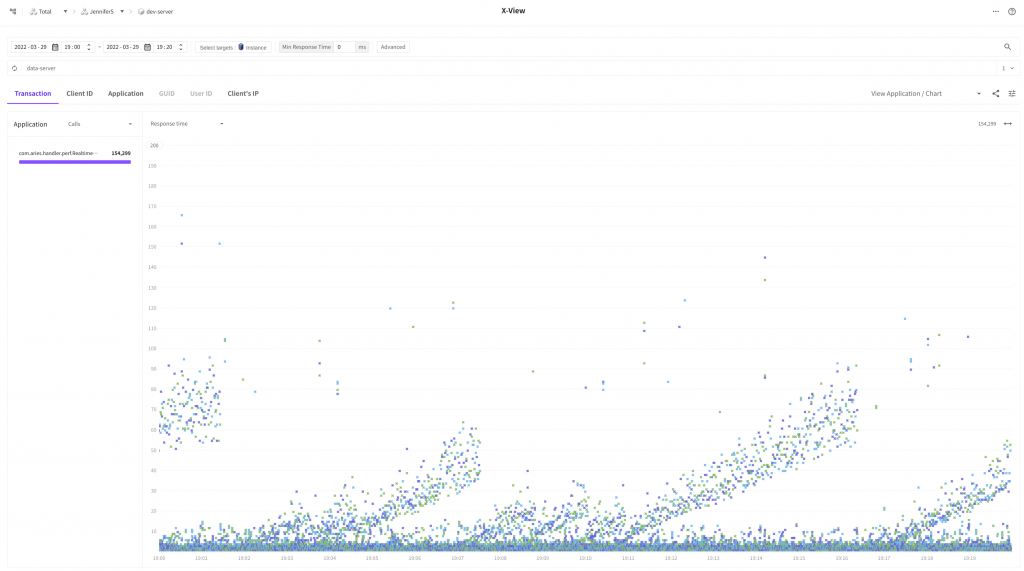
Now, we still see the waves but there are a lot fewer entities in the time section from 40ms to 110ms. We have been able to improve the response time for much more requests than we thought!
Improvement attempts – 2
Developer Y did not stop here, but he couldn’t put down the urge to reduce the response time for transactions looking like waves.
After making greater efforts, he used the memory-mapped file mentioned in Improvement attempt – 1 to change the read parts.
private val map = inner.raf().channel.map(FileChannel.MapMode.READ_ONLY, 0, inner.length())
We used the read-only memory map to pursue simplicity in implementation.
Trying to calm down his beating heart, developer Y applied the code changes and moved to the SFR screen, and press the View button!
Oh.. Now, we no longer see anything related to RandomAccess in TopMethod.
Is there any difference when we use X-View to view it?
Finally, most of the response time for transactions is reduced to below 10ms except for some transactions.
Now, we can see that the dashboard viewing function is improved.
The issue with slow individual requests (even if it is just 200ms..) can be improved significantly. We can very well handle multiple requests that are not in compliance with the recommendation?!
Conclusion
I can recall many incidents I went through because I relied too much on profiles to improve the performance.
Sometimes, it was hard to view too many profiles or had hard times analyzing them because the individual response time for the profile was too low.
Whenever it happens, I wanted to create a performance analysis tool but I wanted to overcome the reality that made me display various comments in the logs or rely on other analysis tools.
For a long period of time, I read the source codes of VisualVM and looked for multiple open sources, trying to look for a good stacktrace based analysis tool.
At that time, sampling was very new to us, so, unfortunately, it took more than 5 years to create a function from a scratch.
