Stacktrace Sampling Based Performance Analysis

The J company that developer Y works for is using an old version of installation type of Jira software
Although the developer knows that it is installed somewhere in IDC and the equipment is very old, it is very difficult to either upgrade it or install it in a new location due to the license policy that requires allocation of license on a hardware basis.
Developer Y with anxiety about the response time that goes down very much sometimes (Why the hell is this slow!)
Developer Y tries to install an APM that the company is developing to do a method profiling, but that attempt fails miserably very soon.
“Which package should I configure?”
“Let’s monitor it first!”
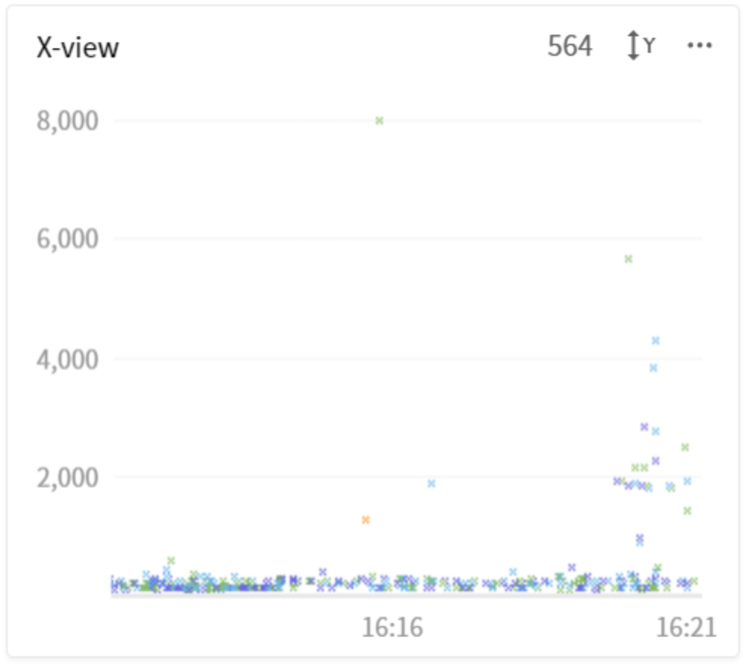
Using the X-View chart, which is the key function of APM installed, developer Y can check the transaction located at the top of the Y axis (Oh, yes..).
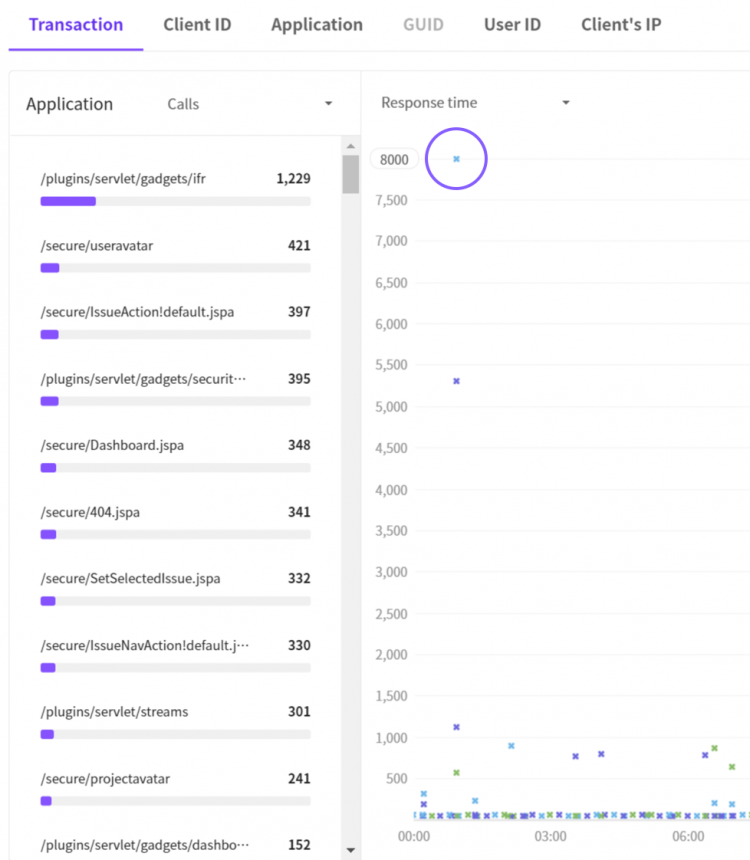
In high spirits, developer Y tries to drag the point that is about to penetrate the ceiling of the chart.
“It takes more than 12 seconds to finish the transaction… What is the reason?”
The area of delay is not a traditional bottleneck such as an SQL or HTTP call, so developer Y feels a heavy heart.
Knowing that Jira is developed by the company called Atlassian,
so developer Y decides to configure the profile of the com.atlassian package.
so developer Y decides to configure the profile of the com.atlassian package.
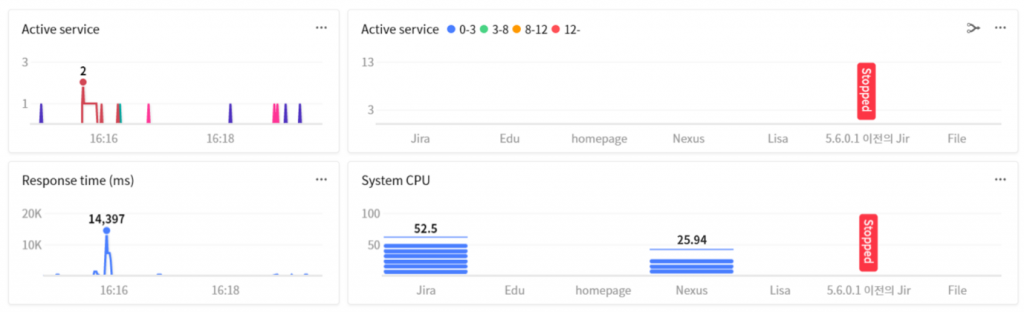
Urghh.. As soon as it is configured, the system CPU usage rate exceeds 52%.
After calming down the worrisome heart, developer Y drags the X-View chart.
Can developer Y find out why it is happening?
Ah.. Although numerous methods are profiled, unfortunately, most of methods take 0ms to 1ms. Looking at the X-View chart, the service response time slows down a lot.
The manager might blame developer Y. (Come on! Cheer up!)
In
this case, is it a bad attempt to do profiling?
If a method of certain class within the configured package caused a delay, it
would have been possible to find out the cause.
However,
in a modern application, very bad performance for a specific method developed
by users does not impact the response time very much.
Because in most environments, it is developed by using a well prepared
framework.
By profiling the com.atlassian package, it is not possible to check the
significant profile information.
In most cases, caches are prepared internally, and it is not very highly likely
to cause a performance problem.
If
there is an SQL or HTTP call that takes long time, then you might want to tune
the target at the remote site, but if there is not, then it would be much more
difficult to resolve.
What if you configure all the packages corresponding to the loaded class(!!)
Maybe we can find it.
But, due to the amount of additional load and data applied to the application,
we will have to pay enormously high costs.
Alright, then how should we analyze the situation?
There are two ways of performance analysis – profiling and sampling.
1. Profiling
It involves collecting performance data from each method that runs and finding and improving the methods that take a long time.
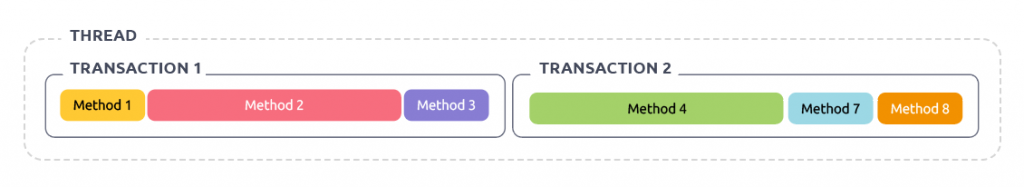
The slowest methods for Transaction1 and Transaction2 are Method2 and Method 4, respectively.
2. Sampleing
It involves collecting performance data from each method that runs and finding and improving the methods that take a long time.
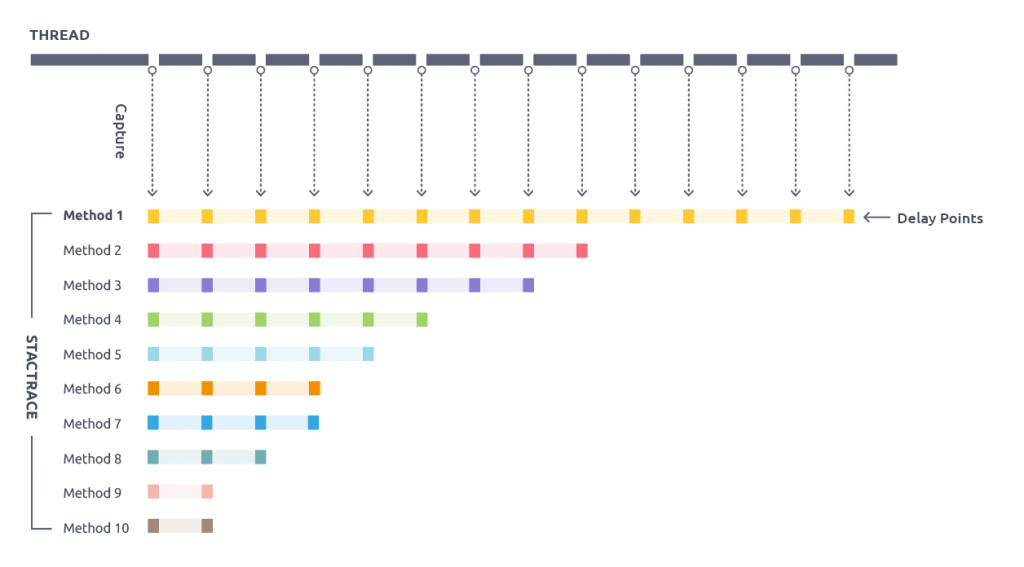
In the figure, we can tell that Method1 is the cause of delay.
Profiling
is a traditional method, so it has been used for a long time throughout
history.
Thus, lots of monitoring products basically provide profiling oriented
functions.
It sounds near perfect, but actually, it has some limitations as follows.
- A user must be aware of the target method to monitor (Maybe developers would know).
- If used for applications in the operation environment with high traffic, the performance can be affected (What if I configure the package with many classes, oops?).
However,
traffic leading to true performance improvement occurs in the operation
environment only.
If there is a way to monitor them in any kind of environment, then it would be
possible to overcome the limitation of profiling?
One of the methods is called sampling
that we discussed earlier.
This method involves finding the location of bottleneck based on the frequency
of appearance by periodically collecting stacktraces from each thread where the
method call is generated, without directly tracking individual methods.
(When the stacktrace is collected 3 times for the time period of 100ms, if
method a appears all 3 times, then we assume that method a is running for
300ms.)
Compared to the profiling based method, it is less accurate, but it relatively
less affects the performance while collecting data.
What are the main causes of processing delays?
- Method that consumes lots of CPU resources
- Method that synchronously processes the I/O
- Method that iterates big collection objects
- Method with unnecessary thread synchronization
Using the stacktrace based sampling method, it is possible to find the above mentioned methods without requiring special configurations. Because whether it consumes lots of CPU resources or processes lots of I/O, the method that runs for a long time always repeatedly appears in the stacktrace.
Of course, sampling is also not a new method, there can be many existing useful tools available.
I like to use the VisualVM tool. It can periodically collect stacktraces from each thread and display the results of call frequency nicely, thus helping you in easily finding the location of bottleneck.
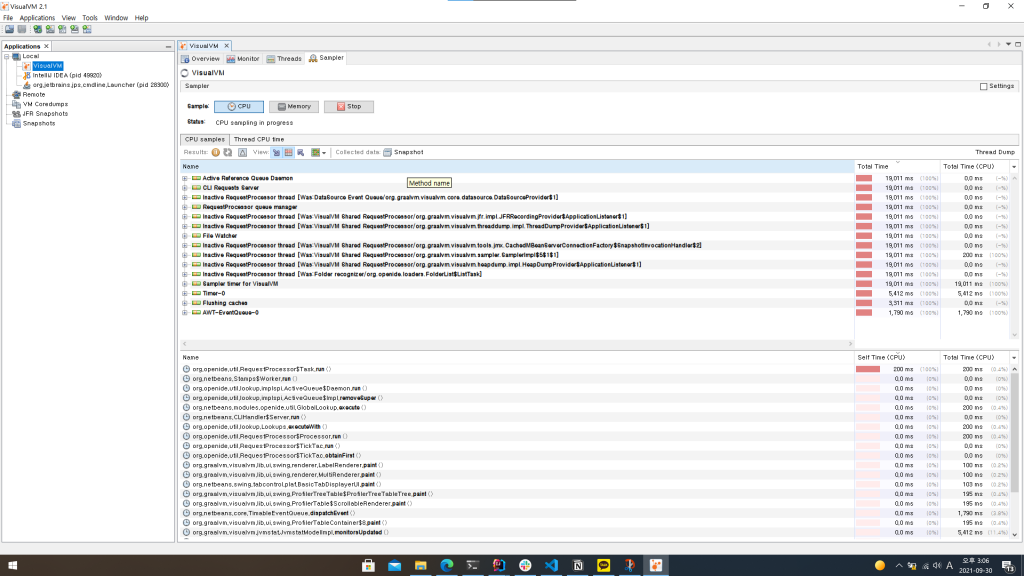
Since it has relatively much less impacts on the performance, you can use it in an operation environment having high traffic without worries.
Actually, it came in handy many times when I tried to improve the performance of the APM collection server which I am responsible for.
After some time has passed, It came across my mind.
“This kind of tool is not available in client’s company.. (There are lots of reasons such as security and so on.)
It would be nice if our product users can experience the effects of sampling based analysis methods.”
“Hah.. It is really good, but I don’t know how to explain it..”
“Come on! Can we just provide the method in our products?!”
Checking individual stacktraces collected from transactions
JENNIFER is also not free from the limitation of profiling that we discussed earlier.
It can easily profile desired methods in real time, but users are required to know where they should look at. Of course, there are many ways to resolve this problem. Mainly, after collecting the stacktrace information in real time, you would look for the profiling target.
- Identifying and selecting the profiling target from stacktrace of specific port by using the socket monitoring function
- Identifying and selecting the profiling target from stacktrace of specific thread by using the thread monitoring function
- Identifying and selecting the profiling target after collecting stacktrace up to the point where a specific class or method is called, by using the dynamic stacktrace function
If there is a call area not found using the above method, the detailed X-View pop-up window will indicate it as a Not Profiled area.
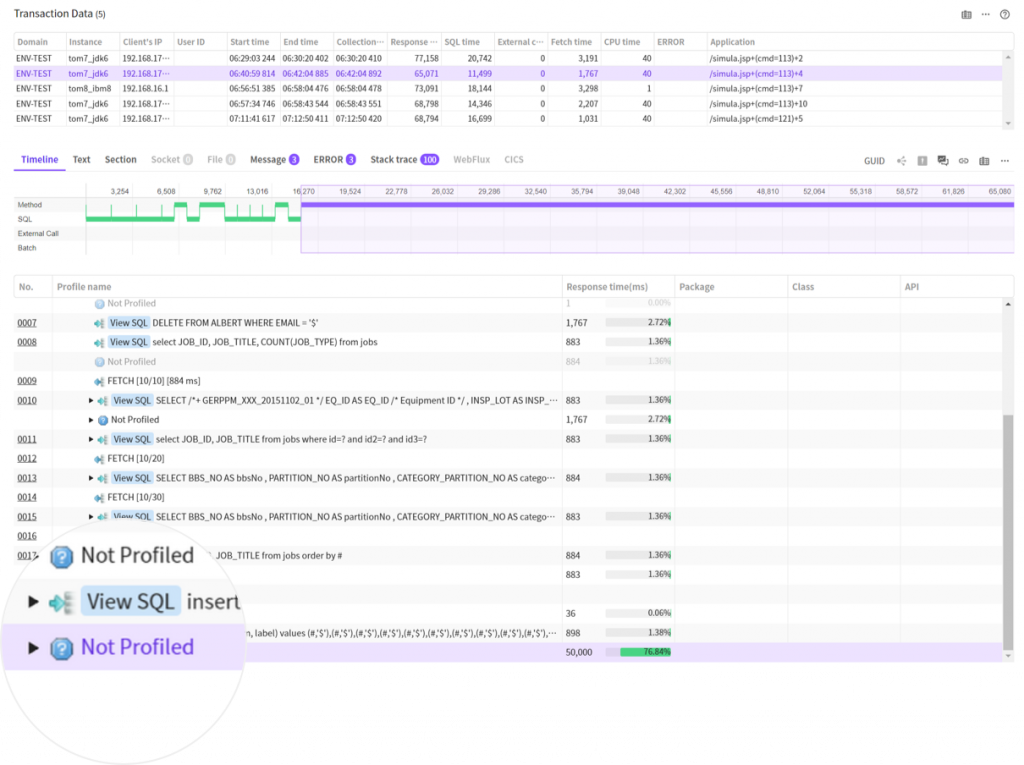
If there is a Not Profiled area that even took slightly long time, then you would want to be able to check what happened there, from the perspectives of monitoring.
So, we decided to collect stacktrace for each transaction and display them in the reverse order of collection time.
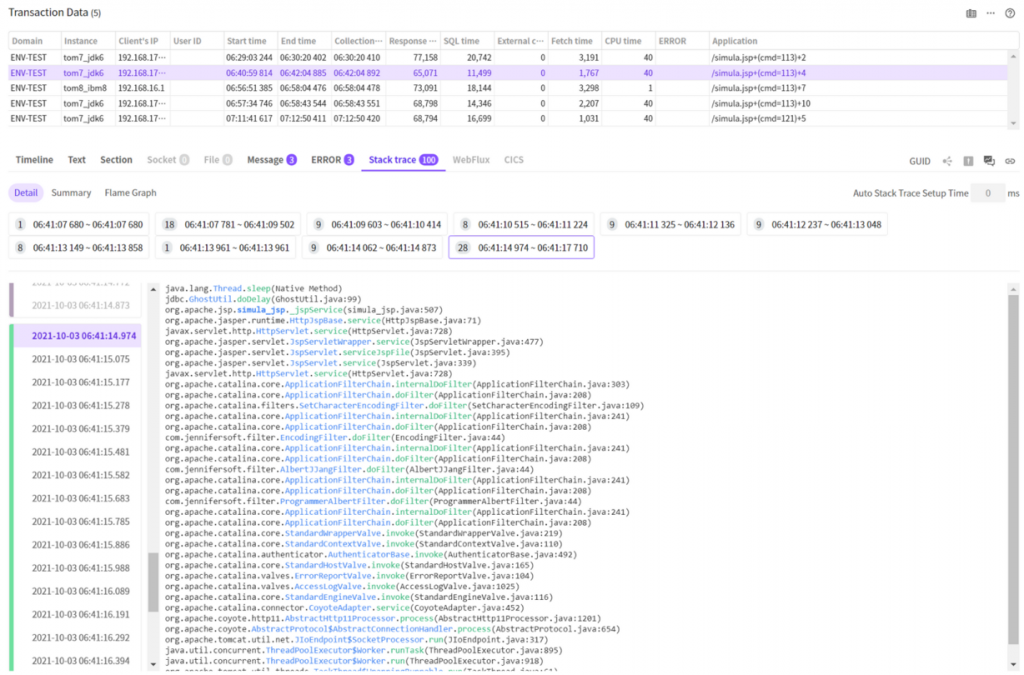
Looking
at stacks listed in the time order, we can check what happened ion each
transaction.
In the above screenshot, most of transactions seem to consistently call the
Thread.sleep() method.
We can guess that the developer intentionally inserted it to implement a demo
environment.
By profiling the method of complied class in jsp, you can just check that the
jspService method took long time, but you wouldn’t be able to assess the actual
cause until you check the actual codes.
Visualizing multiple stacktraces collected from transactions
In the previous example, as transactions run relatively simple tasks, the list of stacktrace can help you roughly understand the cause.
However, if we assume that transaction runs for a long time and it has about 100 stacktraces collected, then it would be very time consuming to check each and every individual stacktrace.
JENNIFER provides two different viewing functions that can facilitate easy analysis in such situations.
Summary viewing
Summary viewing involves analyzing and summarizing the method call relations and displaying the results in trees. Each square bar shown as tree represents a method within a stacktrace and it has three sets of information as follows.
1. Response time
Response
time is measured if it appears at least once within a stacktrace.
It is calculated based on the formula: number of appearance x stacktrace
measurement period. A method with long response time can be concluded as an
entry point to the bottleneck of the system performance.
2. Self Time
Self time is measured when the method is located at the top of stacktrace. In other words, it is the currently running method. The greater the number is the more likely it is the bottleneck of the system. Most of them are methods that generate I/O. In some cases, they can be methods consuming lots of CPU resources.
3. Retained Self Time
Self time is measured when the method is located at the top of stacktrace. In other words, it is the currently running method. The greater the number is the more likely it is the bottleneck of the system. Most of them are methods that generate I/O. In some cases, they can be methods consuming lots of CPU resources.
Flame Chart
Brandon
Gregg proposed a visualization method based on charts.
A single vertical stem is a type of stacktrace. If there are multiple nodes on
top of node, it means that call has been branched out at that point.
Flame chart has the following characteristics.
- Each color indicates that it is a method of the same package.
- Area size of rectangle is the number of collections.
- Method at the bottom of chart is the start point of stacktrace.
- Method at the top of chart is the currently running method.
Based on this fact, to find the most frequently called method during the period, you should find the area with the largest size. The method you found is probably the main cause of specific symptoms during the time (CPU usage, response time delay).
Cases of Usage
Now, let’s analyze the circumstances that developer Y was faced with by using the improved stacktrace function from JENNIFER.
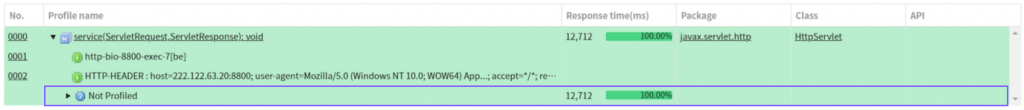
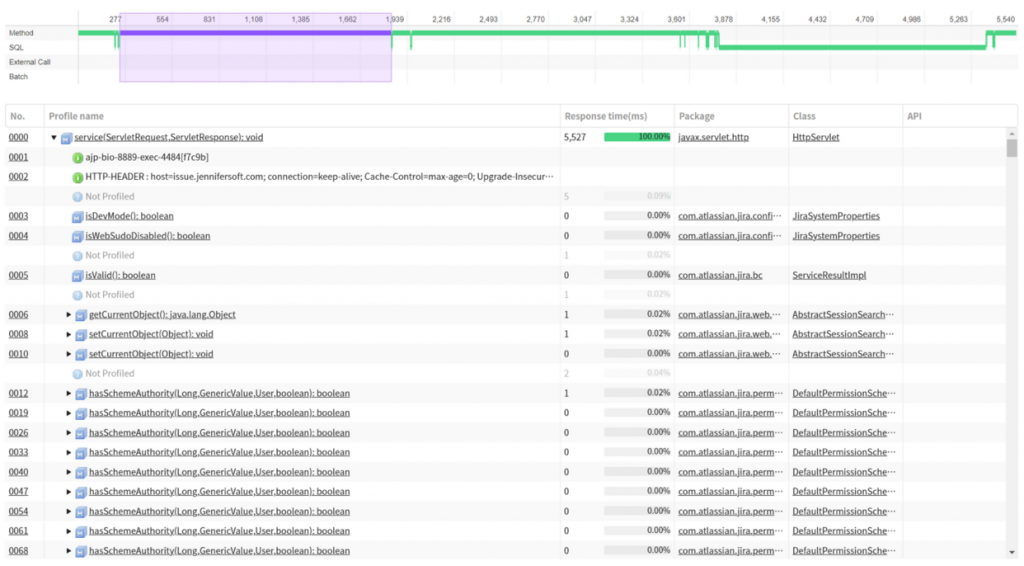
First, let’s check the detailed information of slow transaction in the X-View pop-up window.
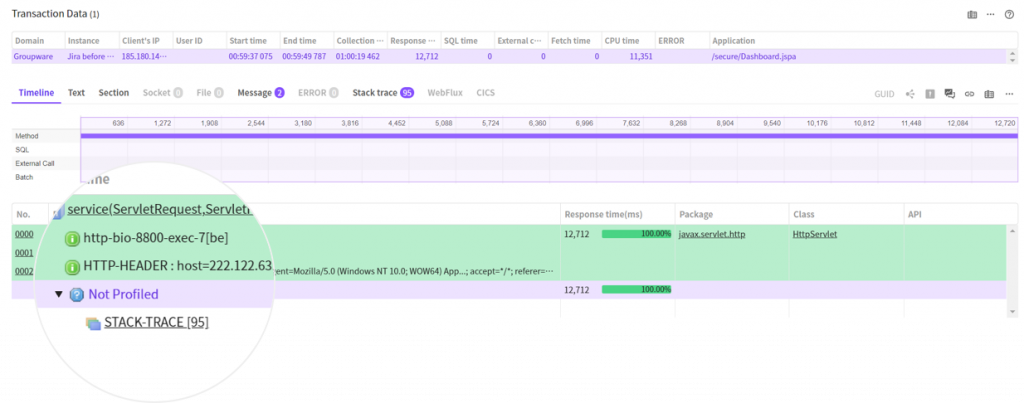
Not Profiled
nodes occupy most of processing time.
We can see that the Not Profiled node has a sub node called STACK-TRACE.
This is the result of displaying the location of stacktrace collection based on
every profile and time information.
The above photo indicates that 95 stacktraces are collected in the Not Profiled
area.
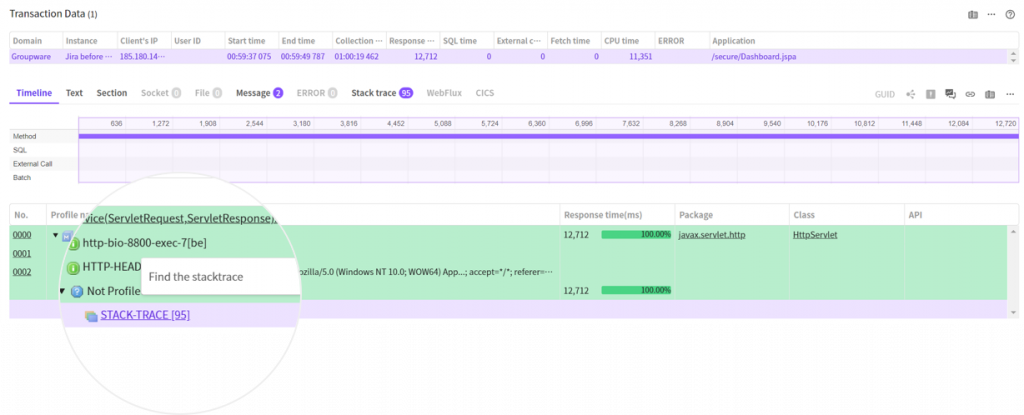
Now, click the STACK-TRACE node to move to the stacktrace tab where the matched
stack group is automatically selected.
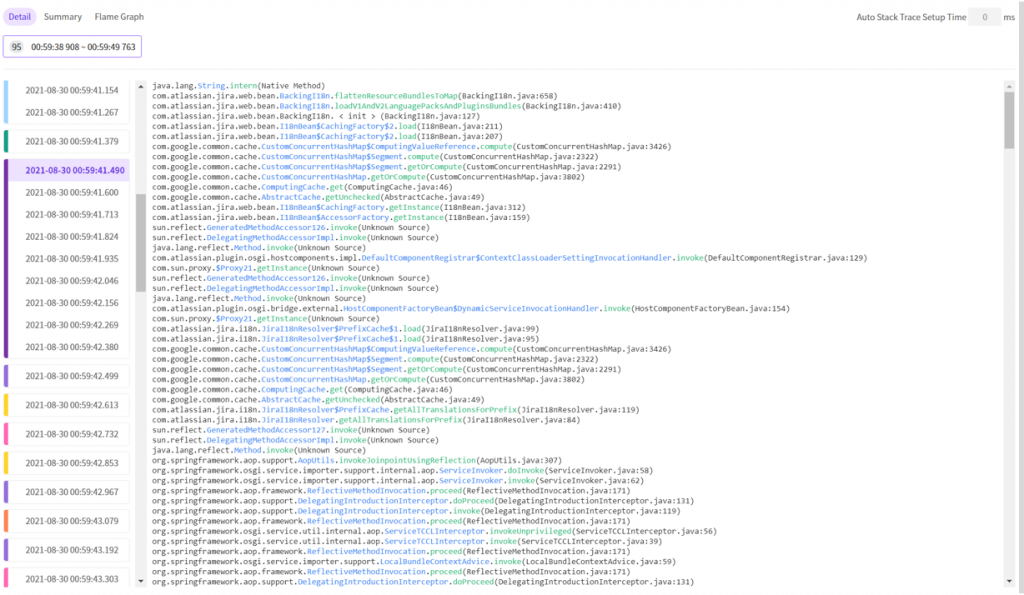
In the previous time line tab, we can see that there are 95 stacktraces in the time section. (Color in front of the time indicates the type of stacktrace.)
If there are sections connected in same color, it means that they are collected consecutively, and we can guess that it has been running for a long time.) In other words, it is a slow method.
In this transaction, especially, the String.intern() method is called many times.
You can scroll down to find sections connected in same color, but using the summary, flame graphs, you can find the method that runs for a long time much more easily.
1. Summary Viewing
You can click the summary viewing option to check the following.
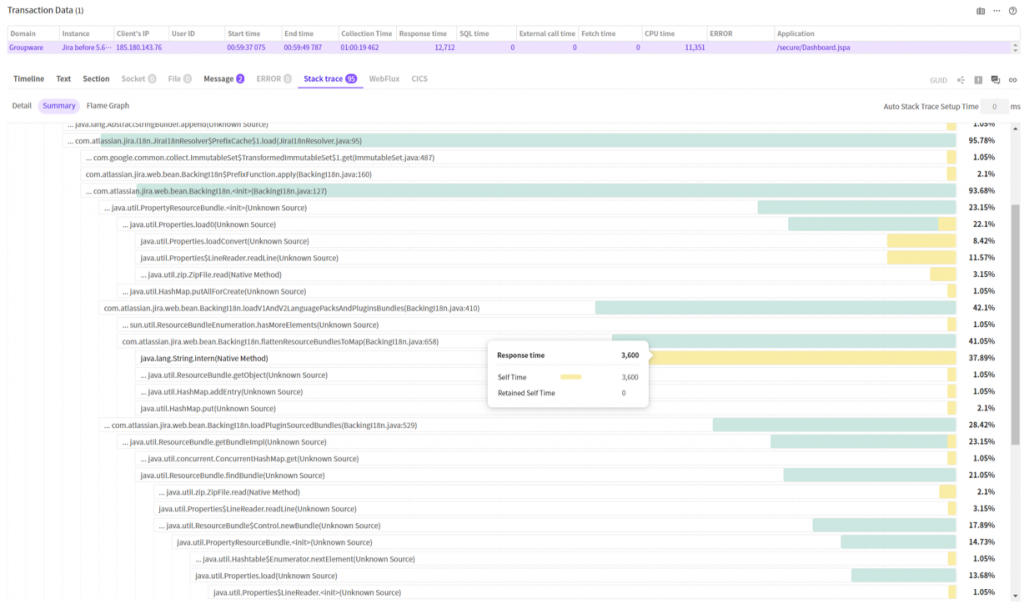
The graph shows a tree obtained by integrating the call relations of each method shown in 95 stacktraces collected.
Here, to find the slowest method or the method that runs most frequently, you should find the node where the yellow bar occupies the largest area size. String.intern() method occupies 37.89%. (In terms of time, it took about 3.6 sec.)
The blue color methods are the ones that include those slow methods.) From the perspectives of analysis, if you want to find the most frequently called method first instead of running methods, then focus on searching for these nodes.
2. Flame graph
Why don’t we check the Flame graph, now?
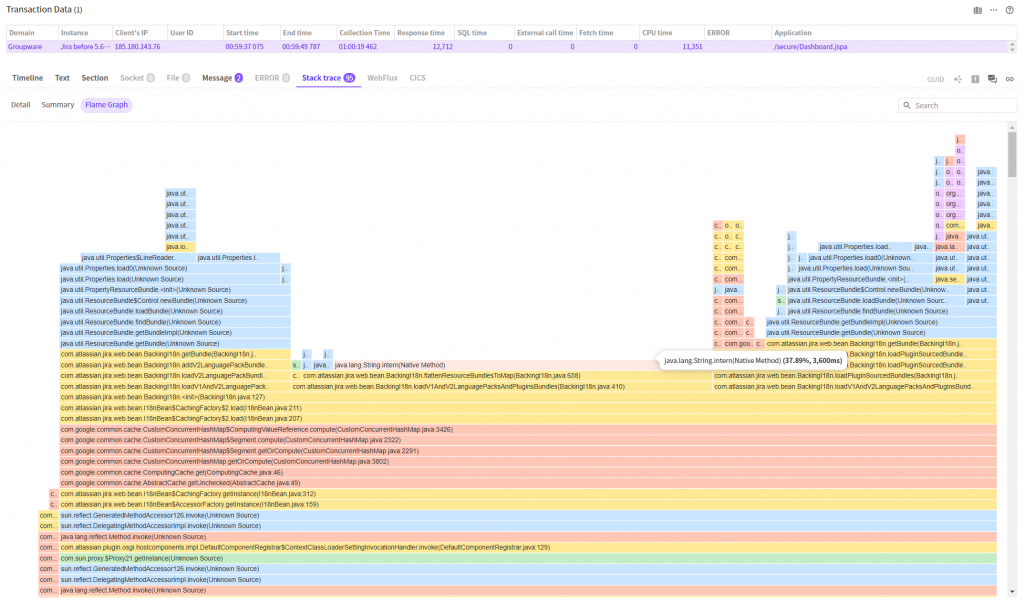
Here, you can see the chart that resembles the shape of flame.
The
slowest method is the one at the top of square area, which occupies the largest
area size. At glance, we can tell that the java.lang.String.intern() method
runs most frequently/
The method in one space below is the method that called the java.lang.String.intern()
method, in other words, it is the
com.atlassian.jira.web.bean.BackingI18n.flattenResourceBundlesToMap(BackingI18n.java:658)
method.
Using these three methods, we reached the conclusion that the method that has
been running for the longest time is the String.intern method and the method
that called this method is the BackingI18n.flattenResourceBundlesToMap method.
Now, I am curious why these methods are slow.
First, I want to check the BackingI18n class. Looking at the package name, it is atlassian, the code for Jira. It means that we cannot open our modify the source codes.
Then, let’s focus on analyzing the String.intern method.
This is a native method that is provided by basic JDK versions.
If the text string sent as parameter to the text string pool managed by JVM does not exist in the text string pool, then it is inserted before being returned. Otherwise, if it does, then it is returned after finding a match in the text string pool.
Simply put, it prevents duplicate generation of the same text string, thus reducing the memory usage rate. By the way, it takes more than 3 seconds. Isn’t it strange?
Let’s search for the method by keywords as follows.
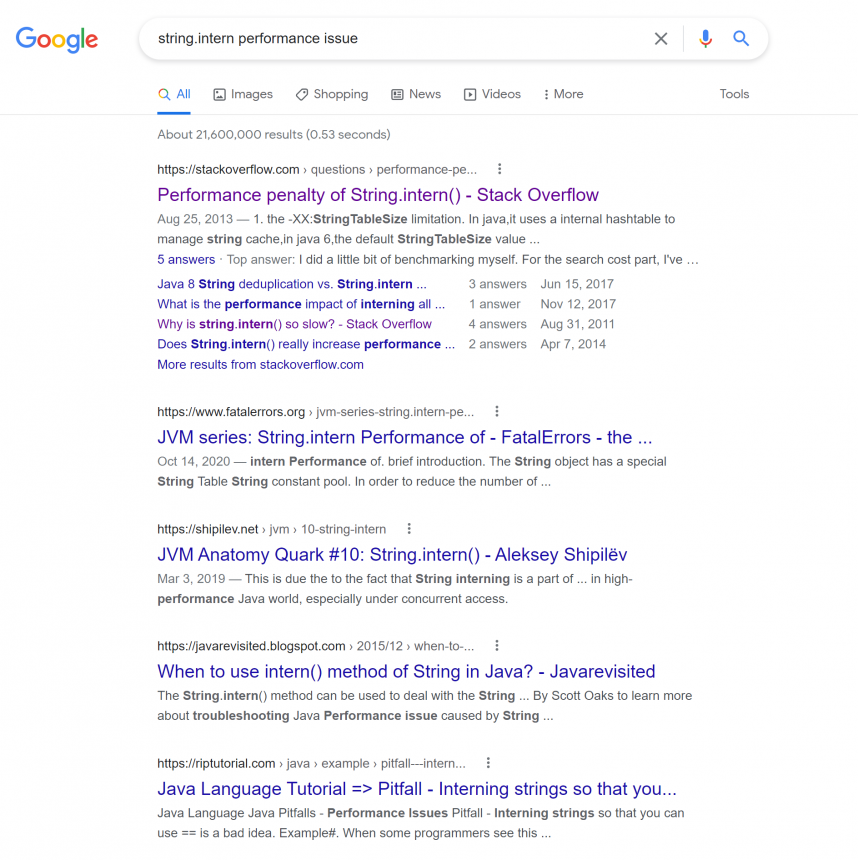
Looking at the first search result, we can see the information about the String.intern method that is differently implemented and operated for each JDK version.
http://java-performance.info/string-intern-in-java-6-7-8/
The following is a summary of the above content.
- JDK6 – Text string pool is managed in the PermGen area and it is a fixed size, so you are not recommended to use it. You are recommended to implement text string pool as a map for use.
- JDK7 – Text string pool is managed in the heap area. The default size of 1009 up to right before jdku40. Increased to 60013 at jdku40.
- JDK8 – Text string pool is managed in the heap area. Default size of 60013
So, developer Y decides to check the JDK version for any luck.
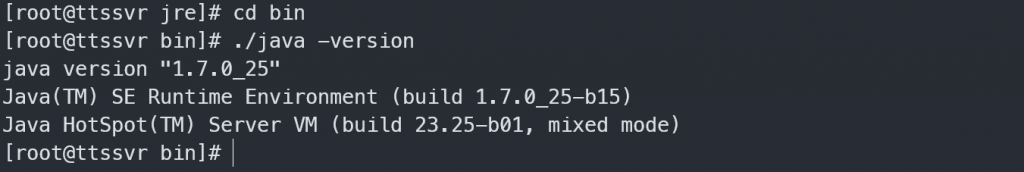
Ah.. JDK version is 1.7.0_25.
If so, let’s assume that the default size of text string pool is 1009 and as text strings exceeding this size are accumulated, adequate hash distribution keeps failing.) (Unless the data within the map is distributed by using a proper hash algorithm, the more the data the slower the viewing speed gets.)
If this is the actual cause of performance degradation, then you can expect some performance improvements simply by increasing the text string pool size.
I set the text string pool size in the Jira scripts as follows. The size is same as the default size of JDK8.

Now, let’s restart Jira and observe what is going on.
About one month later
After applying the option, the response time of Jira has been greatly improved. Now, as I am about to close the chapters, I can feel very good, which cannot be compared to the previous time (Of course, depending on persons, the level of performance improvement might vary little.
Just in case, I have collected and recorded the performance information before changing the settings. I was curious how much improvement there actually existed.
I felt improvements but I wanted to verify them with numbers. So, I compared the previous and current status by using the application status, performance browser functions and so on.
1. Application status
The following results are call counts sorted in the descending order.
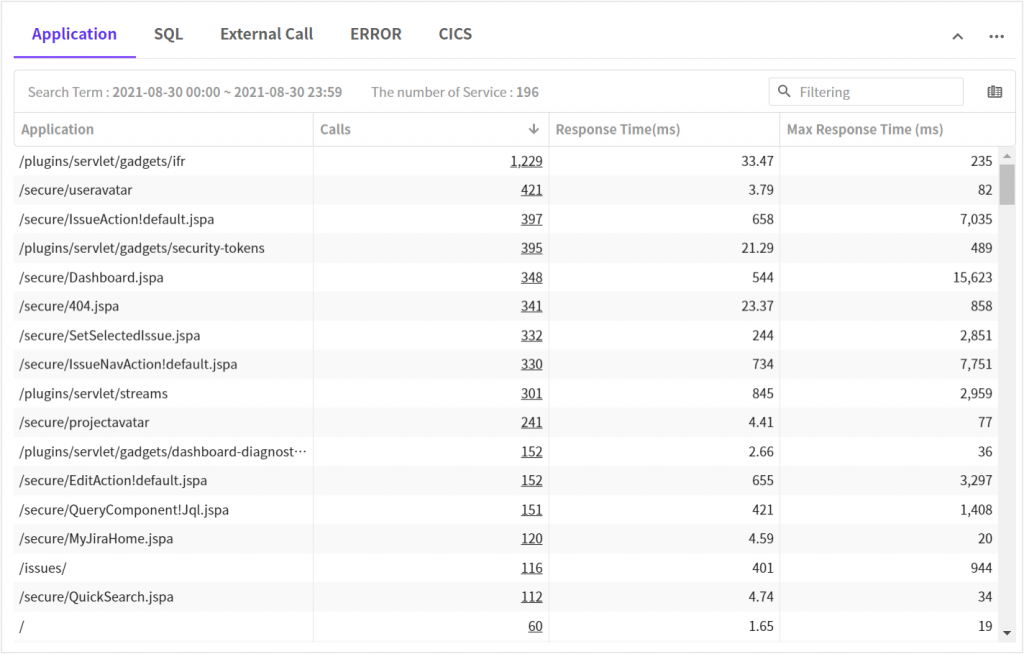
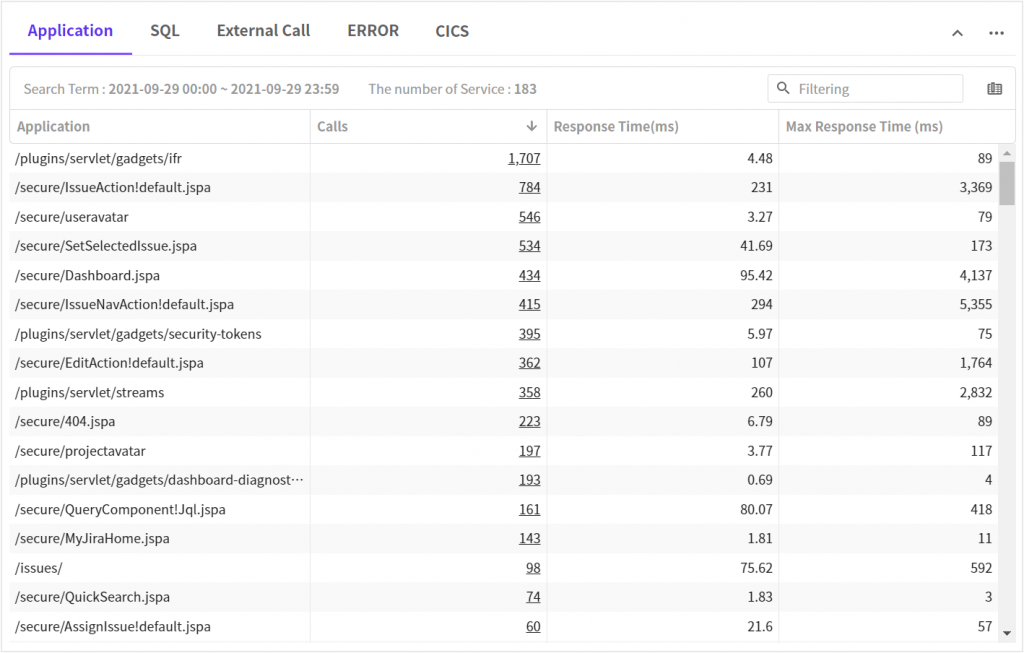
At glance, we can see that the average and max response times are improved.
2. Performance brwoser
Response time
This time, we have drawn comparisons of several factors that can affect the performance by using the performance browser function.
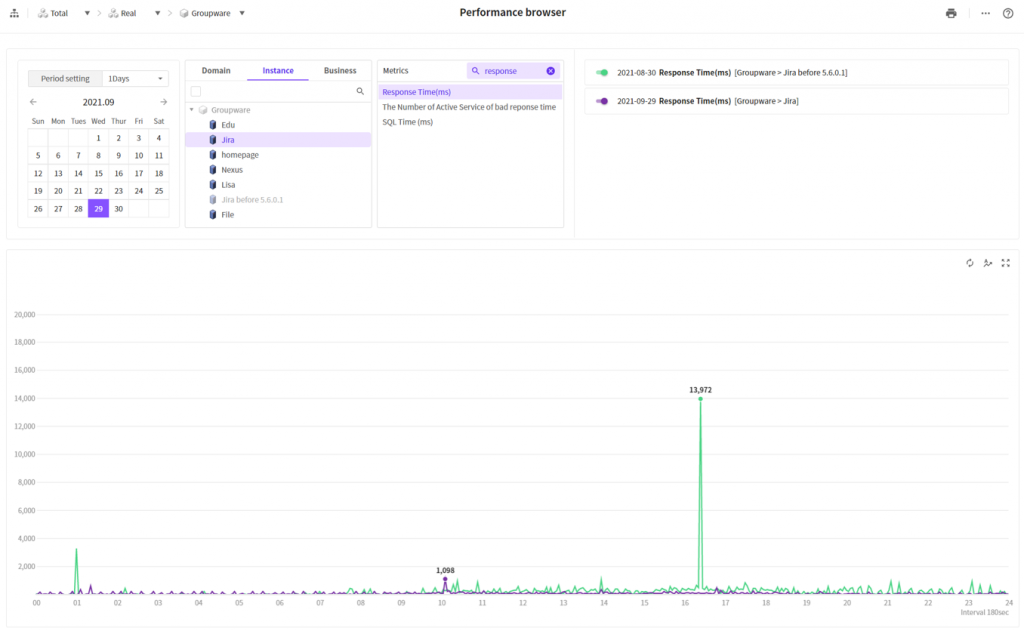
The purple color indicates one month after it is applied.
The green color indicates the existing status. The purple color indicates one month after it is applied. We can see that there is overall improvement of general situation or peak time.
CPU time per transaction
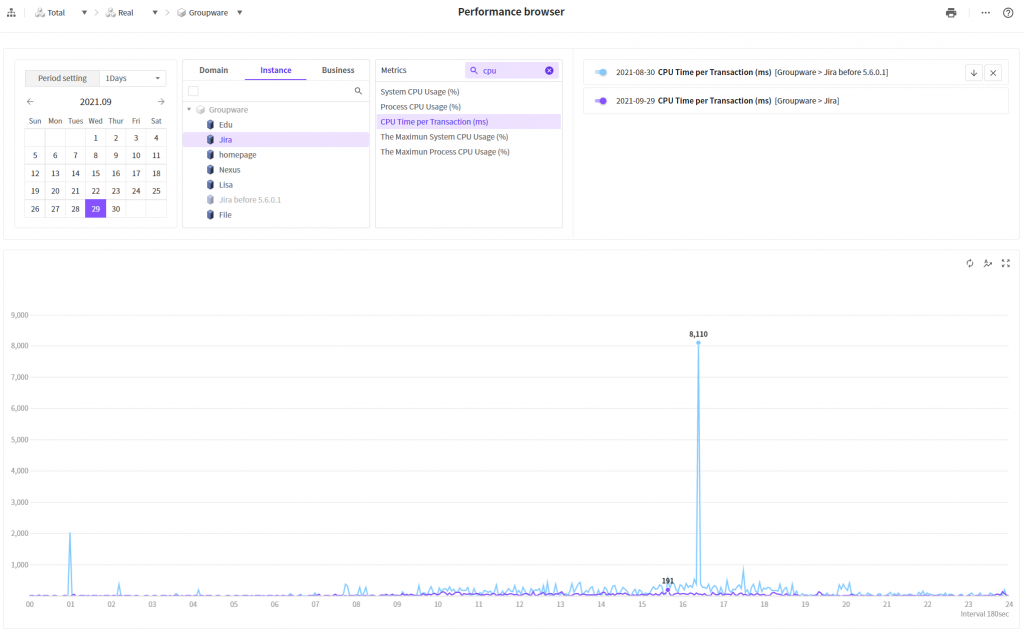
Sky color line indicates
the time before improvement while the purple color indicates the time after
improvement.
We can see here as well that the CPU time per transaction is greatly reduced
after improvement.
Improvement you feel is proven with actual futures!
3. X-View
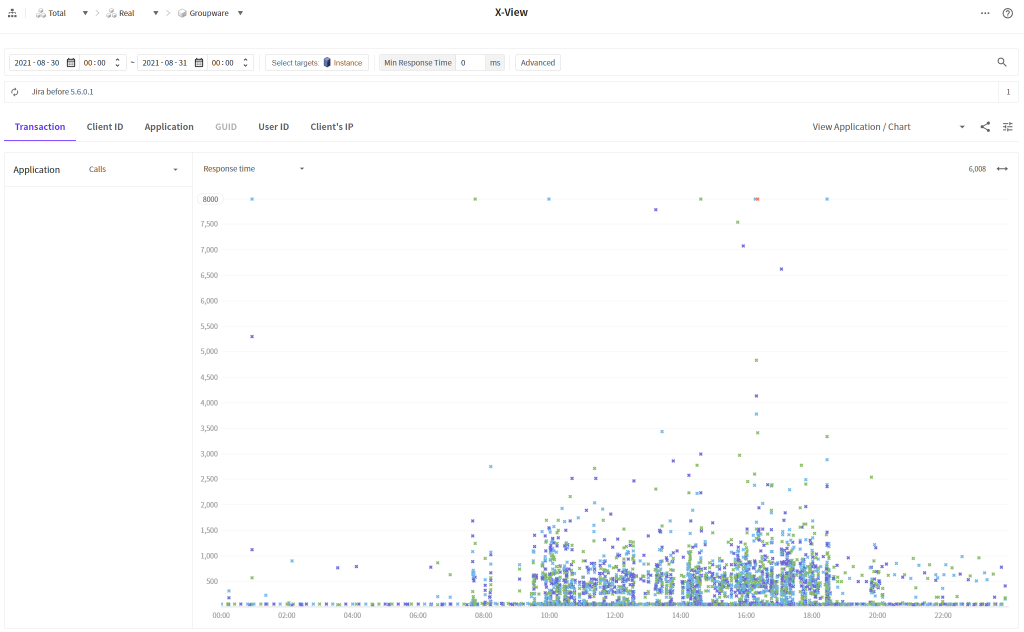
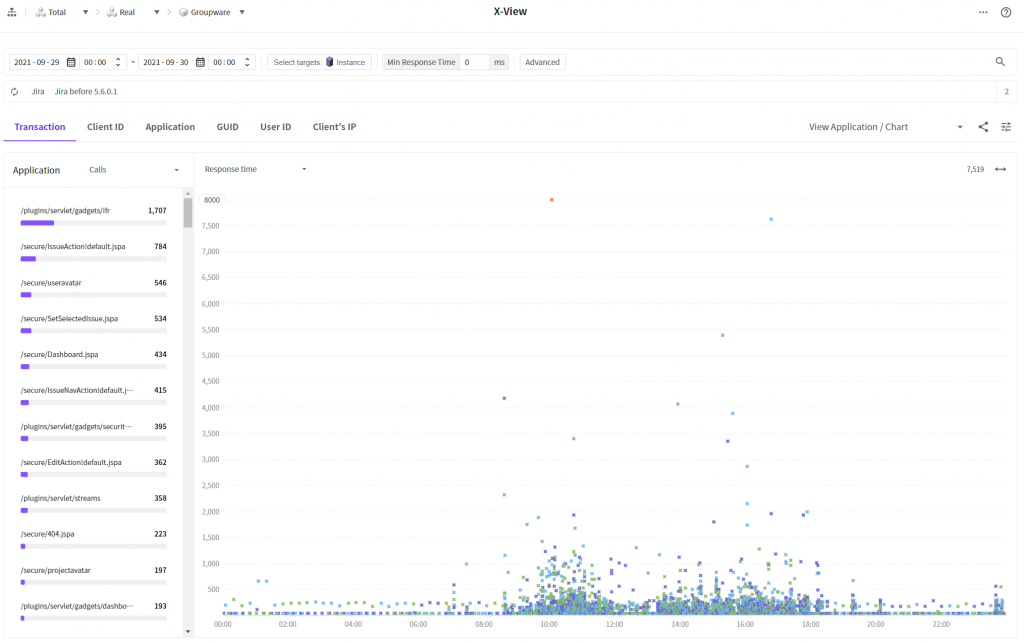
Finally, we compared data on the X-View chart before and after improvement is made.
We can check that there are more densely populated transactions at the bottom. It means that the overall response time is improved.
Conclusion
I was little worried before introducing you to the improved stacktrace function.
That is because it was very hard for me to find a good example to help you understand the effects of sampling based analysis function that I experienced.
Thanks to the installation type of Jira software (issue management system) where the performance periodically degrades, fortunately, I was able to find a good example to explain the performance improvement in an actual system to users.
In our example, using a general method profiling based method, it would be very hard to derive the results we obtained.
Profiling the java.lang package is not a good approach. The problematic String.intern method is not a native method. That is why.
Now, I would like to close our chapters, wishing that the JENNIFER function that I just discussed can be helpful in resolving performance issues that you might have overlooked or even given up.
JENNIFER is preparing an analysis function based on the stacktrace of entire system beside stacktrace of individual transactions. The function will greatly help you in resolving performance issues that cannot be analyzed from the transaction perspectives. So, you may be full of high anticipations
