The role of the APM and DevOps Culture (2) (DevOps+JENNIFER)

Event Alarm Setup (Operation)
JENNIFER allows users to create an event by setting the type of application error including compile error, response time delay, OOM or by setting the service or the status of system such as the number of active service, response time, CPU usage rate, heap memory usage rate. When creating an event, you can activate the external link, and SMTP (Simple Mail Transfer Protocol) module is provided as default. JENNIFER also provides an interface and utility for customers to initiate the event module by themselves. One of its customers created separate WAS alert system by linking its own alert system to JENNIFER event.

Service Load Control (Operation)
JENNIFER allows users to control the amount of service load by providing the PLC (Peak Load Control.) Users are able to set the number of minimum/maximum number of active service that becomes threshold of blocking the inflow of transaction. JENNIFER also allows users to setup a guide message or redirect page when the number exceeds the threshold.

If the number of active service in progress exceeds the threshold on the target application (server or WAS,) the incoming user request would not be accepted, such request would not be reflected on the active service equalizer chart, and its color would turn red.
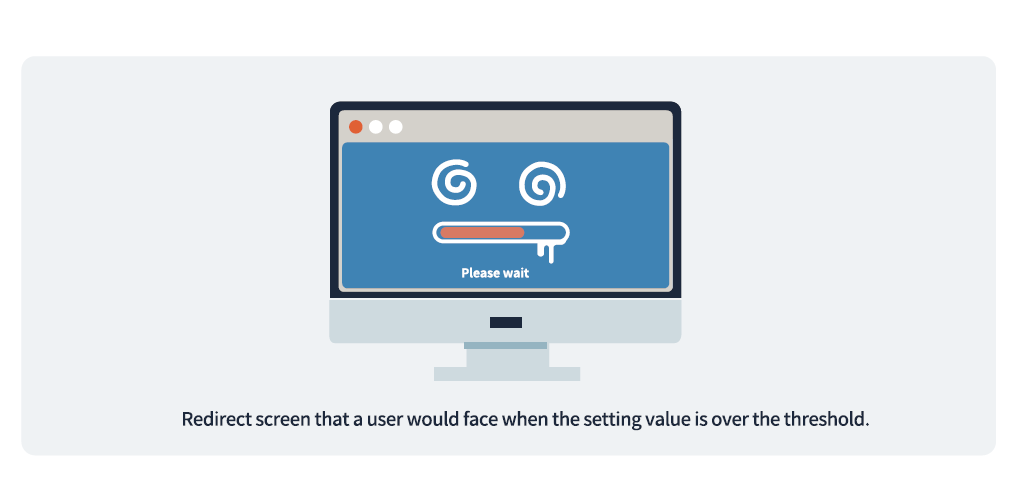
If the request is denied, you could notice the message you set on the PLC management screen or the display will be redirected like below. If the number of active service on the target application is below the threshold, the display could go back to its original place.

Problem Analysis (Development)
You need to know the target package or class to analyze the profile data against individual transaction. Depending on the range of application, the size of profile data could grow much bigger. Therefore, it could be burden on the actual service. The auto-profiling and stack-trace provided by JENNIFER is suitable to use at the operating level as it only applies to the transaction that exceeds the response time you set.
The profile indicates a feature analyzing the calling structure of method that becomes the starting point of transaction. The stack-trace indicates that it leaves a log on the method structure when the transaction exceeds the threshold.

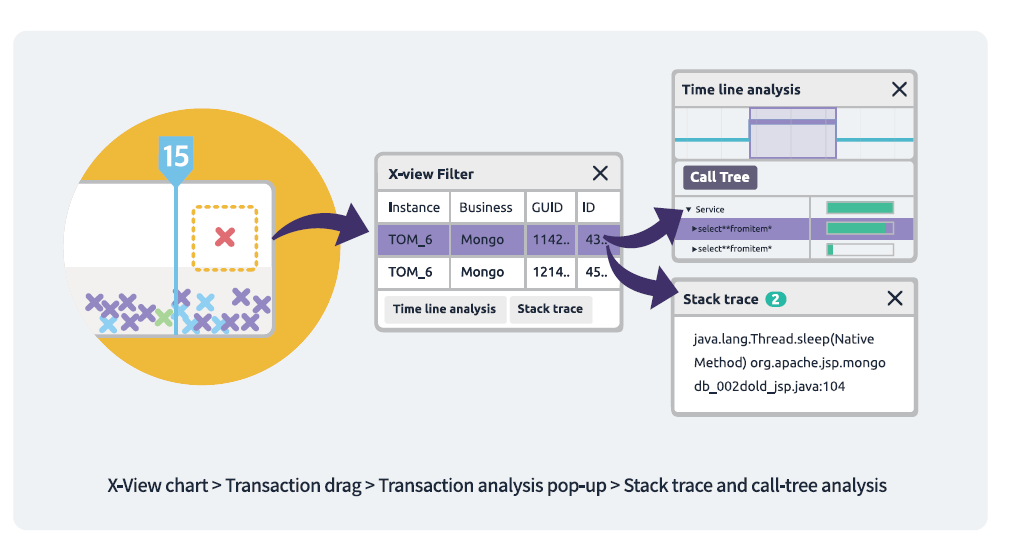
If you find a transaction that seems to exceed the response time you set on the distribution chart, you might want to look up the stack trace information through transaction analysis screen or you can search the profile data that caused the delay sector by sector to identify the exact location of irregular method through call-tree.
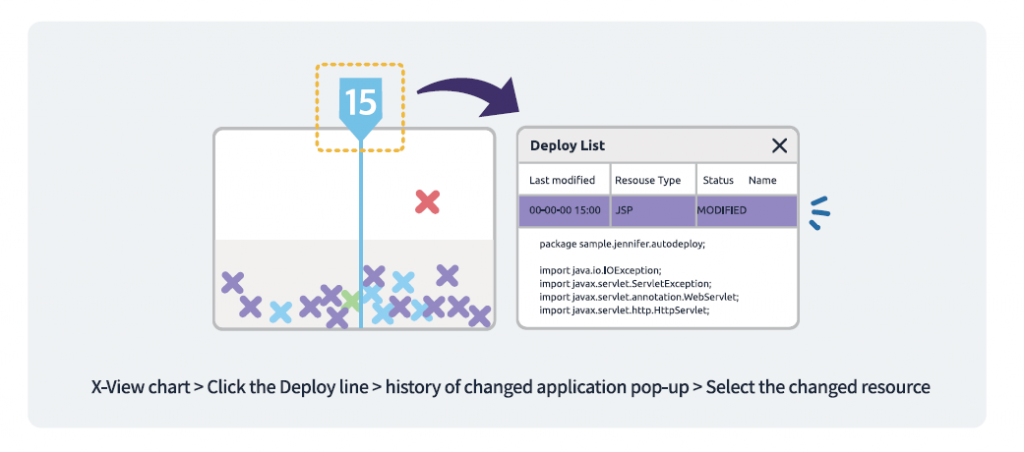
Once the source code is published, a vertical line appears on the transaction distribution chart. If you select the line, you can search the list of newly added or changed resources. The code review feature analyzes the contents before and after publishing the resource. It allows developers not to analyze the source code reflected during the developing stage.
If the active service has not been swiftly processed after the publish, and the pattern of transaction distribution chart is differently formed comparing to the existing one, a newly added source code is likely to have problems.

Conclusion
Culture Shock is defined as a sense of shock and fear when people exposed to a new lifestyle, an alien culture or environment that are totally different from the environment they belong. It is not much different in IT industry. DevOps has been getting continuous attention from a few years ago, and it is one of developing methods that many software development organizations have tried. Unfortunately, it has not been fully adapted due to resistance toward a new culture.
