Using JENNIFER Auto Stacktrace
A stack trace has been one of the most powerful tools at developer disposal, as it provides meaningful insights about transactions execution. While stack traces usually associated with exceptions thrown by the program, it can also be used to understand and analyze application’s transactions as well as pinpointing bottleneck location in some situations.
JENNIFER Auto Stacktrace is a handy function that can help in analyzing and debugging application transactions in some circumstances such as when there is no enough profile information available.
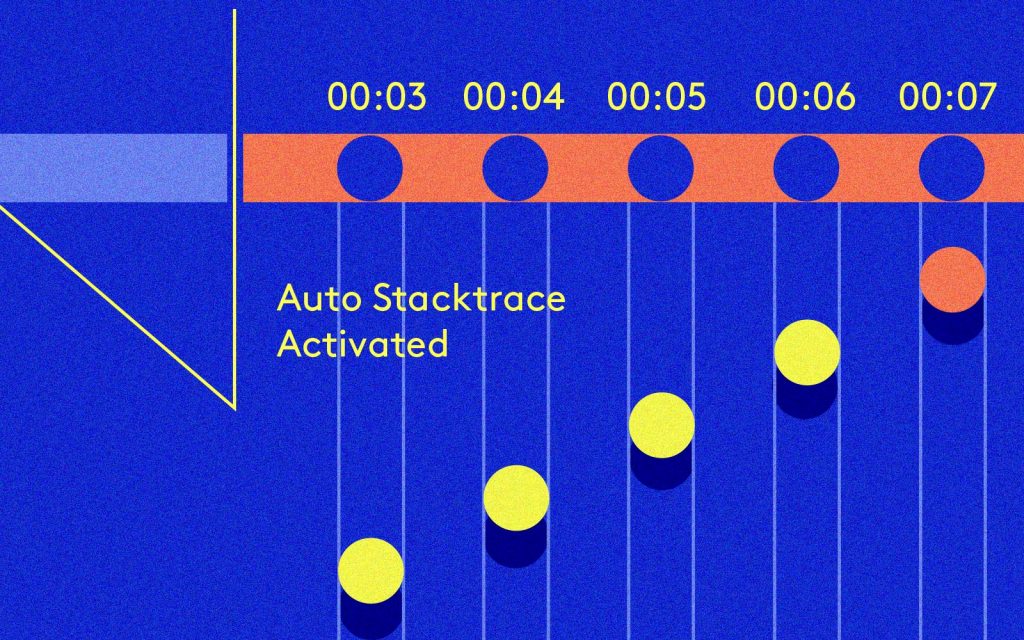
When a transaction is taking longer than usual to complete, then JENNIFER will automatically start to collect stack trace snapshots until the transaction is complete. Those snapshots are then made available in the transaction details in JENNIFER X-View.
Auto Stacktrace Configuration
By default, JENNIFER will start collecting transaction stack trace when the transaction is taking more 8 seconds to complete. This threshold can be configured and adjusted to fit your need using the Auto Stacktrace menu item in the management screen.
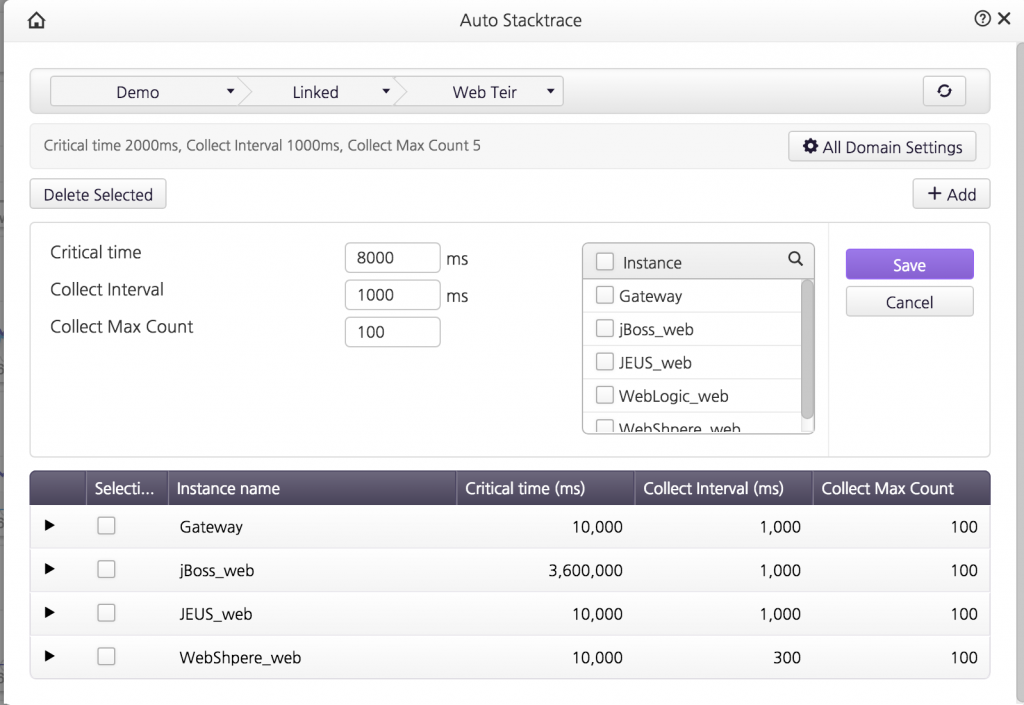
The Auto Stacktrace menu item has 3 settings. They can be used to configure the Auto Stacktrace function. Those settings description is as follow:
1- Critical Time
- This is the threshold that JENNIFER will use to trigger the Auto Stacktrace collection. When transaction execution exceeds this threshold value, then JENNIFER will start to collect stack trace periodically based on the collect interval value until the transaction is completed.
2- Collect Interval
- Stacktrace collect interval
3- Collect Max Count
- The maximum number of stack traces to be collected.
For example, if a transaction is taking 10 seconds to complete, then JENNIFER will collect 2 stack traces based on the above configuration. The max count settings can be thought of as a safeguard to avoid too much data when a transaction is taking a long time to complete.
Using the Auto Stacktrace
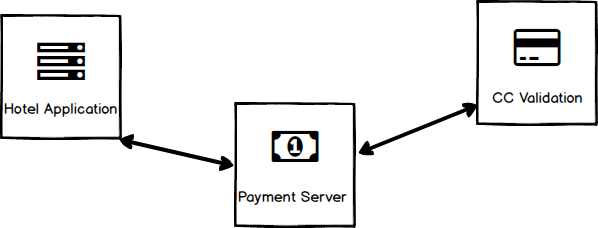
To help us understand this function, we will look at the following example. We have a hotel system that consists of 3 application (3 agents). The main application is the hotel system itself where users can browse the hotel rooms and services. The second application is the hotel payment server and the last application is the credit card validation service.
Let us assume that there was a performance problem in the system which results in service queuing. The service queuing phenomena can be observed clearly in JENNIFER dashboard. However, to analyze the problem and find the root cause additional information will be required, typically we will rely on the transaction’s profile to aid us in finding the root cause of the problem. Unfortunately, in this case, the dynamic profiling function in JENNIFER at the time of the problem was not active, thus the X-View profile information will contain minimal data about the transaction.
At this moment the Auto Stacktrace function can come in handy as JENNIFER automatically collected the stack-trace information about the slow transactions.
When Analyzing the slow transaction in X-view we can see that the problem was associated with the room booking transactions. However, since the booking transaction is jumping through 3 servers (payment and validation) we still need more information about the root cause.
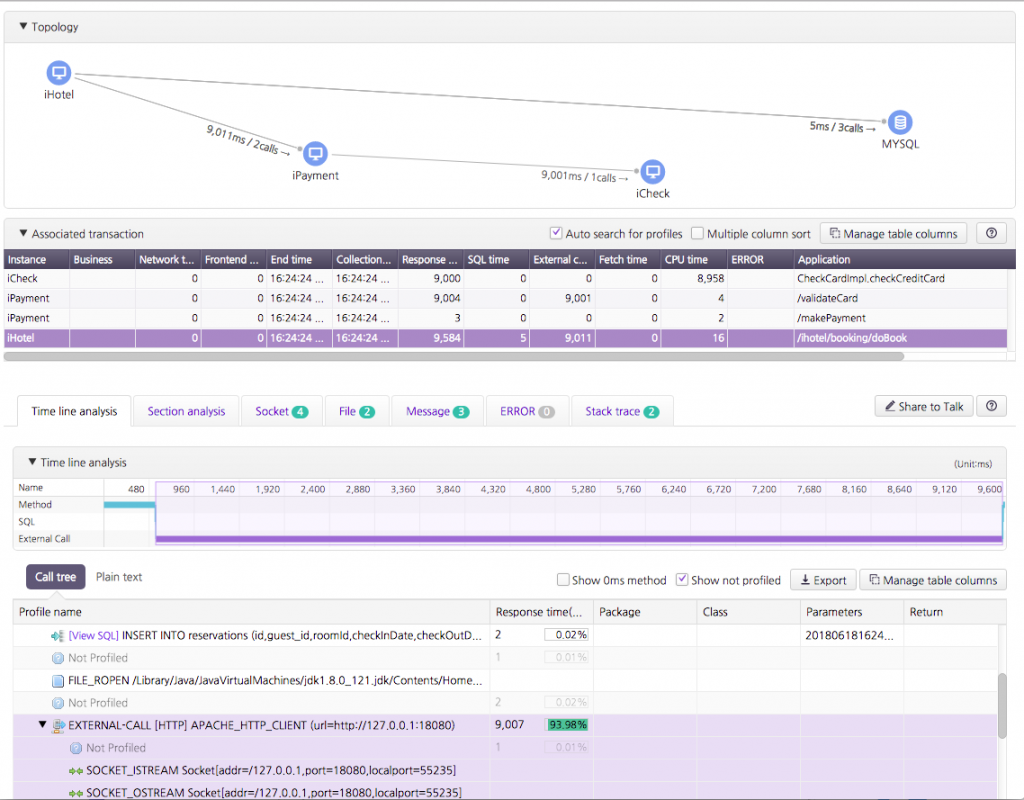
By investigating the X-View we can notice that the problem is originating at the iCheck server (credit card validation), so we narrowed down the location of the problem but we still need more information. As described earlier, the dynamic profiling function was not active. So the profile information in JENNIFER will just show us that the problem is located at the application code (Method Segment).
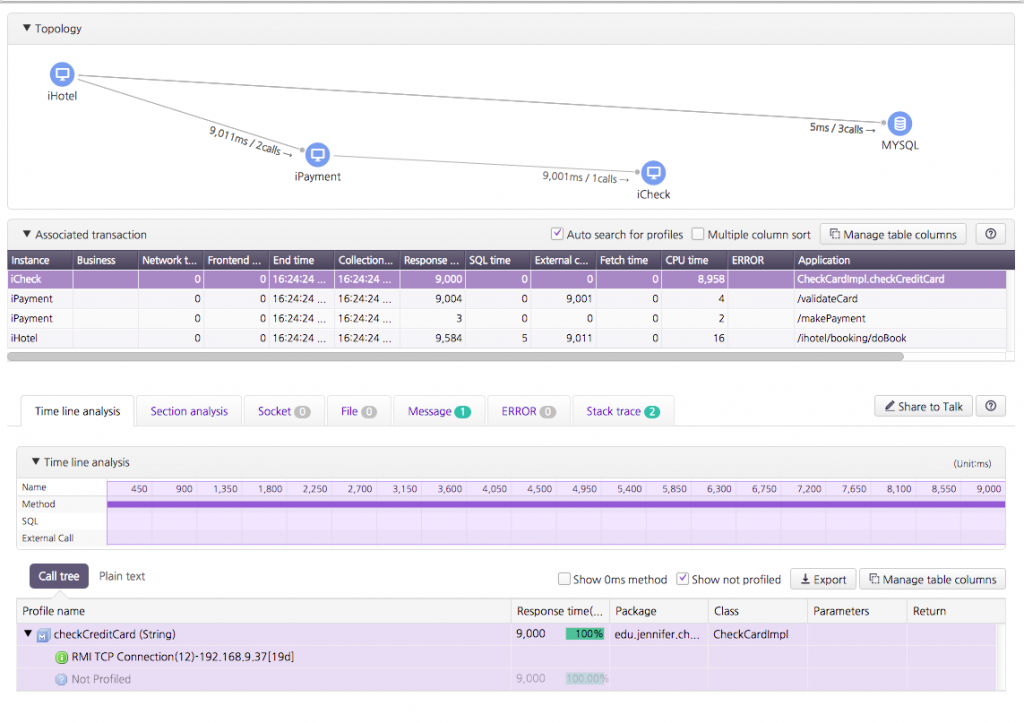
However, as this transaction was taking longer than the 8 seconds threshold, we can notice that JENNIFER already collected 2 stack trace snapshots. When we analyze those stack traces we found that the application running thread was stuck at the checkValid method.
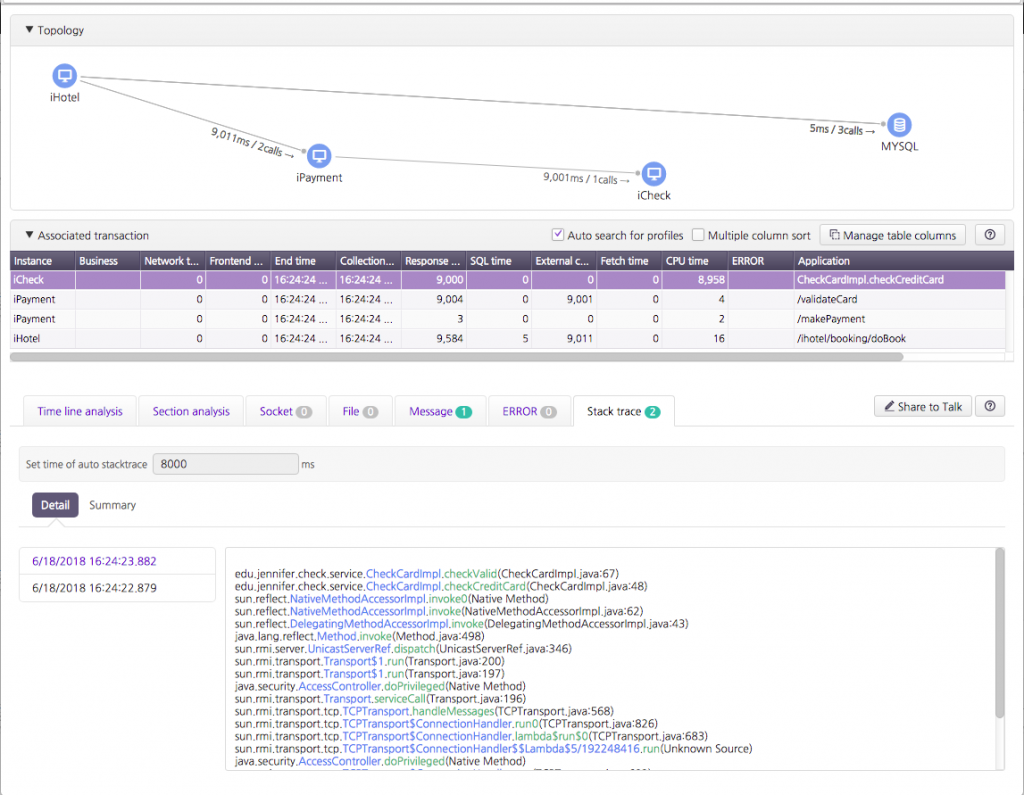
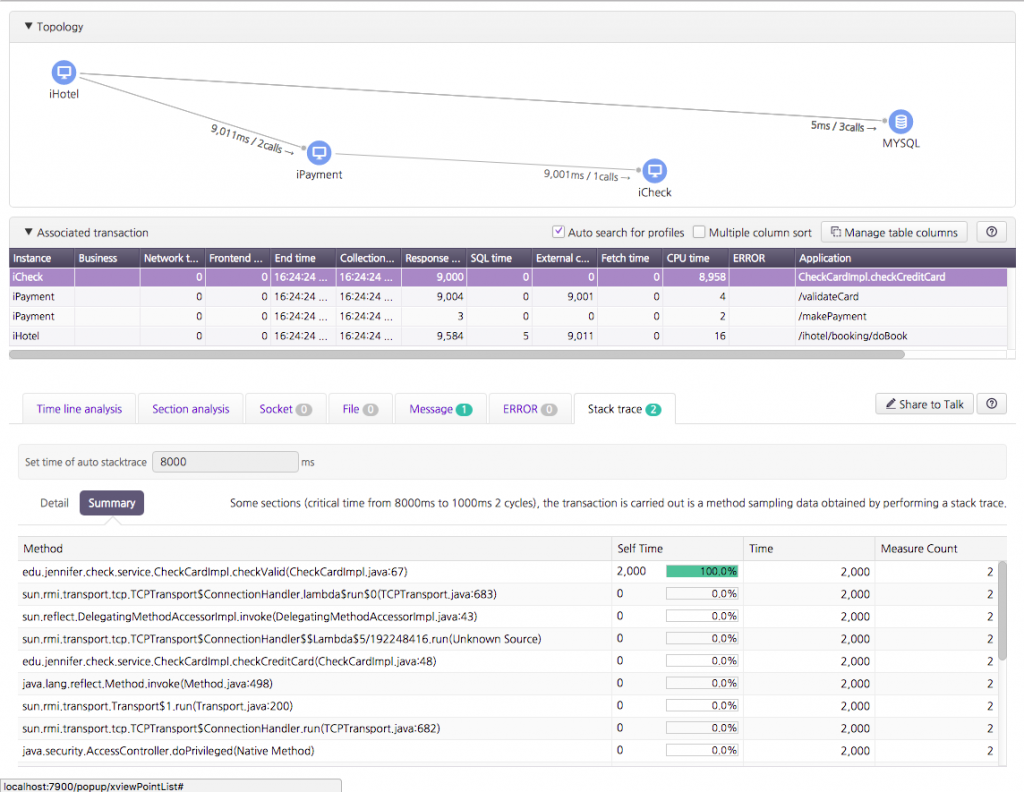
The Stack trace screen has 2 tabs, the Details tab allows you to analyze each stack trace collected by JENNIFER individually. While the Summary tab shows the execution summary of each individual method. This information includes Class name and line of code, Method execution time, Method execution count.
Still have problems? Use the forum to post your question or email support.ko@jennifersoft.com
