What is Deployment Indicator
When a new version of the code is deployed in production, JENNIFER can automatically detect this change and display the changed resource in the deployment. A vertical line will be drawn on the Real-Time X-View. This line is referred to as the deployment indicator.
How To use Deployment Indicator
The deployment indicator can be used to analyze pre and post-deployment issues as well as isolating or pinpoint the performance problem location. Since X-View visualizes all the transactions in Real-Time, adding the deploying indicator will make it easier to know if the new code is causing a problem or no.
Let us consider the following scenario, a new version of the application is deployed, and shortly after performance issues starts to appear.
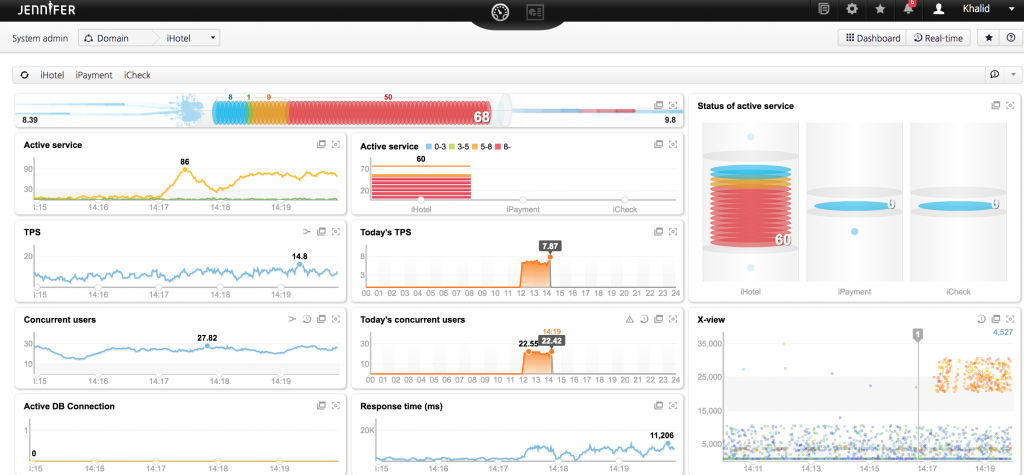
By examining JENNIFER Real-Time X-View, we can see that a deployment took place around 2:17 pm. and a single WAR file was deployed as the number on top of the deployment indicator shows.
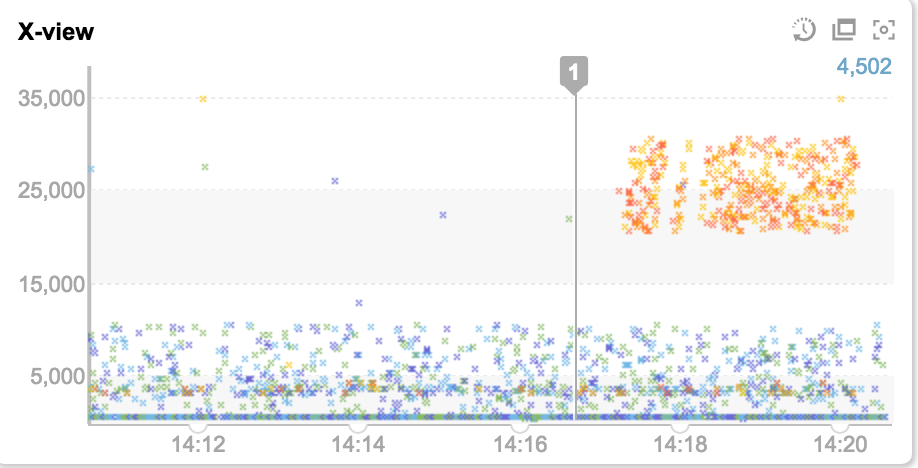
Before the new code was deployment, the transactions distribution on X-View was normal and average response time as around 6 seconds. However, after the new code is deployed, we can see that the average response time increased to about 25 seconds, and several exceptions were occurring.
Interacting with the Deployment Indicator
Double clicking on the deployment indicator will show the Source Code (resource) history pop-up window. This window contains additional details about the deployment such as Deployment Date/Time, Agent, Deployed file(s) name as well size. Selecting a file from the deploy list will show the changed resources.
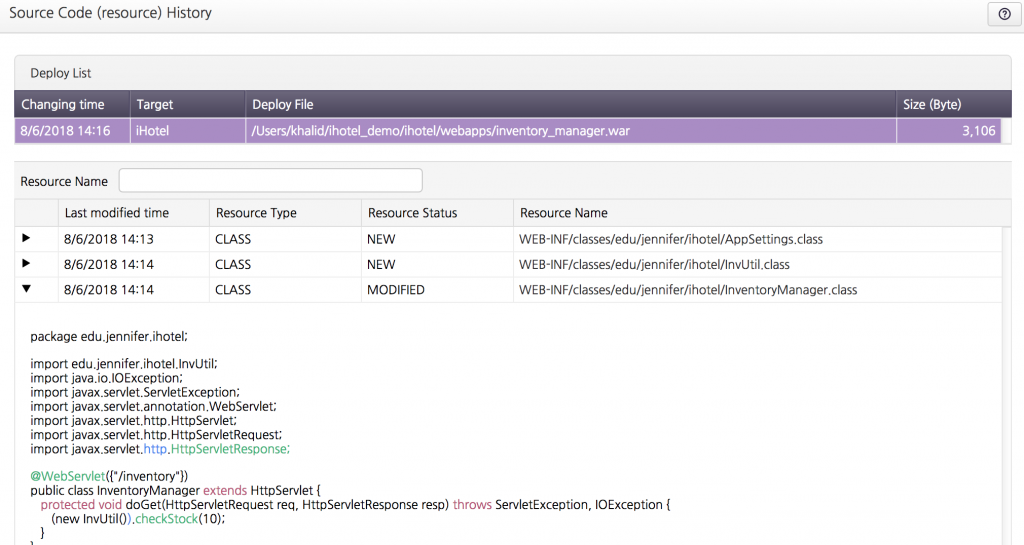
In the previous image, we can see that inventory_manager.war was deployed to IHotel instance on the system. JENNIFER automatically detected that this deployed contains 2 new Java Classes: AppSetting and InvUtil as well as modified resources, the InventoryManager, along with their source code. This information can be extremely useful in pinpoint the root cause of the problem, comparing this information with X-View transaction and Events data, we can see that most errors were thrown from the InventoryManager and InvUtil.
Source Code (resource) History
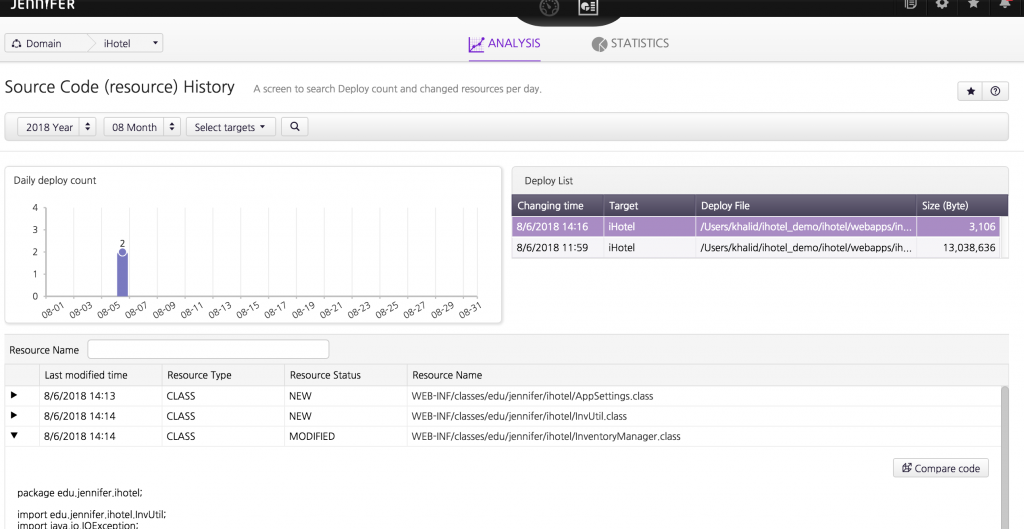
The source code (resources) history menu is located in the Analysis perspective of JENNIFER, you can use it to analyze all past deployment. This screen will allow you to search for deployment that took place in a specific month.
In the following image, we can see that 2 deployments took place on the 5th of August 2018.
Source Code Difference
JENNIFER has the ability to show the difference in the source code compare to the previous deployment. In order to use this functionality, you will need to enable the Souce Code Diff Plugin. The plugin is already shipped with JENNIFER and the code of the plugin is available at our Github Repository.
To enable the plugin,
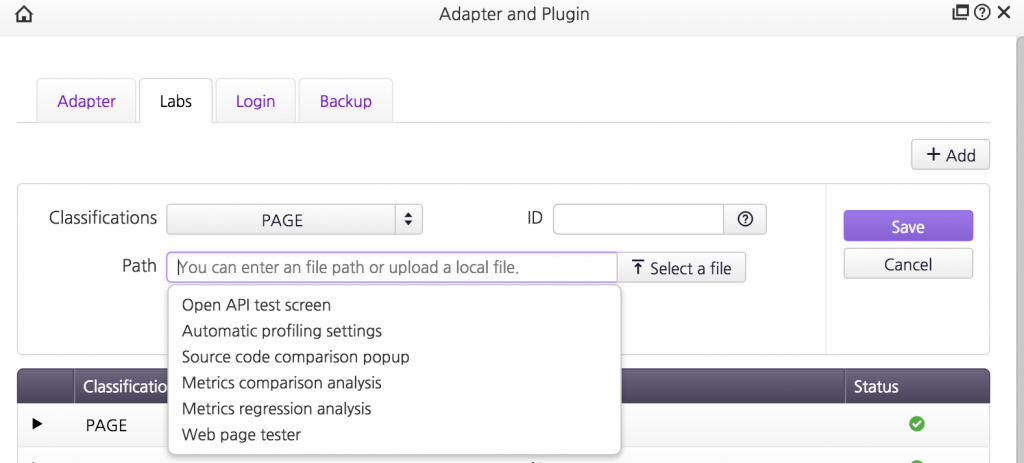
- Selectthe Adapter and Plugin menu item from the Management menu.
- Then under the Labs Tab, click the [+Add] button to add the plugin.
- Make sure the plugin Classifications is set to PAGE.
- Click anywhere in the Path text field to display a list of available plugins.
- Select “Source Code Comparision Popup“
- Save the changes.
Finally, restart the view server to apply the changes. After a restart, you should see the status of the plugin turned to green color.
Now, if you head back to Souce code (resource) history page. You should be able to click on the “Compare Code” button.
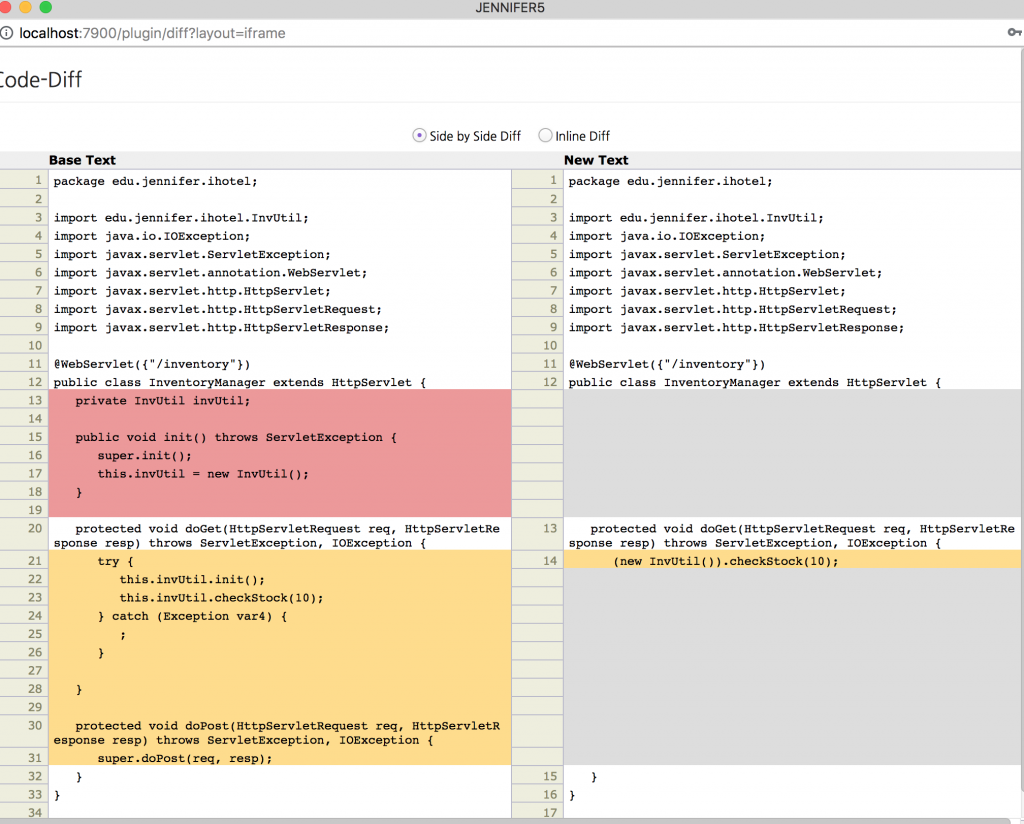
Once you click on the compare code button, a pop up menu will appear showing the difference in code between the current deployment and the previous one.
Source Code (resource) History Configurations
If you are deploying a WAR file, then no configurations are required, JENNIFER will auto-detect those changes and keep track of them.
Additionally, you can configure JENNIFER to monitor a specific directory for changes. From the management screen menu, you can select the Source Code (resource) History menu to open the configuration screen.
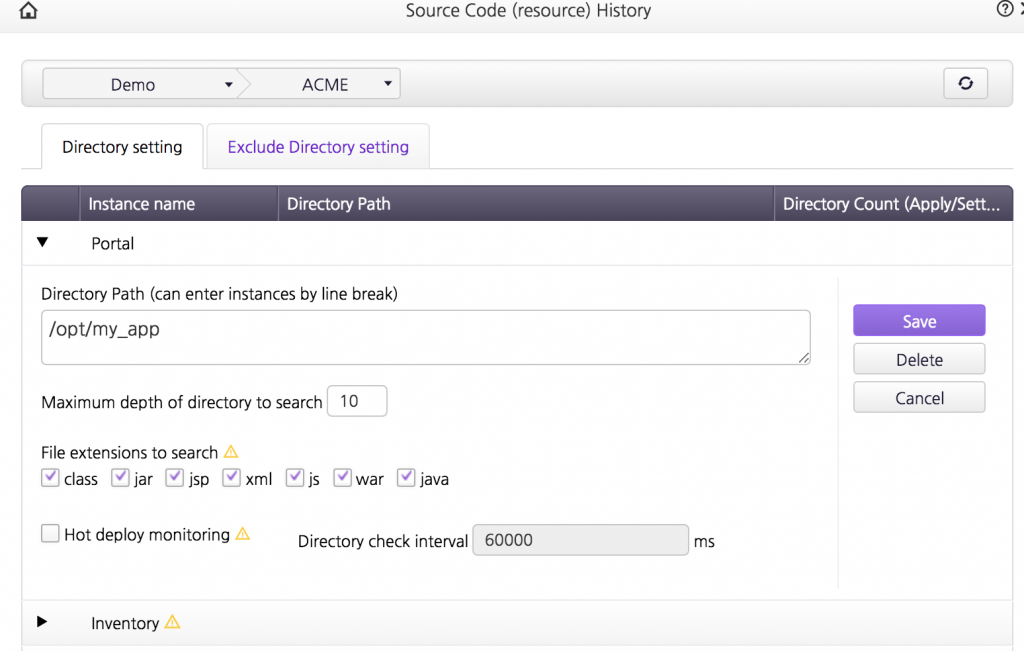
Enter directory path you want JENNIFER to keep track of changes inside it. You can enter multiple directories separated by a line break (newline).
You can specify the number of sub-directories to search within using the Maximum depth of directory search setting. For example, if you want to search within 3 sub-directories level deep only, you can set the value to 3. You can also select specific file types to keep track of by selecting the required file extensions.
Still have problems? Use the forum to post your question or email support.ko@jennifersoft.com
