Spring Batch Monitoring with JENNIFER

In this article, we will introduce you to how to trace application transactions that use a spring batch with Jennifer.
1. Basic Operation of Spring Batch
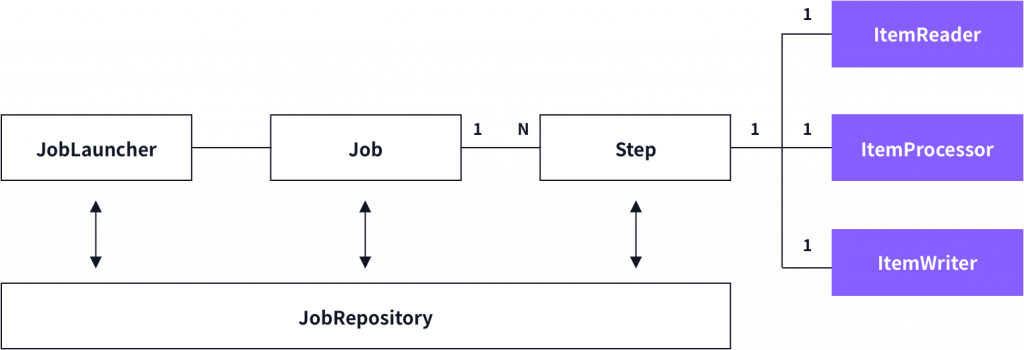
Let’s first take a look at the basic operational structure of spring batch. Basically, a spring batch is run by implementing necessary logic in the unit of step, which is an independent job unit.
Steps can
be divided into tasklet based steps and chunk based steps.
If you want to use a tasklet based step, then you have to implement a tasklet.
Until the step is terminated, the execute method will be repeatedly executed.
Tasklet based step is generally used in a lot in jobs such as initialization, execution of saving procedures, alarm transmission and so on.
Let’s first take a look at the basic operation structure of spring batch. Basically, a spring batch is run by implementing necessary logics in the unit of step, which is an independent job unit.
Steps can
be divided into tasklet based steps and chunk based steps.
If you want to use a tasklet based step, then you have to implement a tasklet.
Until the step is terminated, the execute method will be repeatedly executed.
Tasklet based step is generally used in a lot in jobs such as initialization, execution of saving procedures, alarm transmission and so on.
2. Spring Batch Transaction Monitoring with JENNIFER
Once you have activated the Spring Batch Monitoring option in Jennifer, Jennifer will begin to detect batch execution in step discussed earlier and then monitor transactions in step.
Once the transaction starts, it will detect each individual step running in the order of execution as spring batch inside the transaction and then trace entire transactions.
The following sample code shows how Jennifer detects spring batch steps and monitors them accordingly.
A total of 6 steps from the start step to the end step are defined in the sample code. The sample code was prepared in such a way that a different SQL will run in each step.
@Bean<br>
     public Job chunkBasedJob() {<br>
         return jobBuilderFactory.get(JOB_NAME).incrementer(new RunIdIncrementer()). //<br>
                 start(step("Start Step")). //  <br>
                 next(step("Step One")). //<br>
                 next(step("Step Two")). //<br>
                 next(chunkStep("chunk first Step", 10)). //<br>
                 next(chunkStep("chunk Second Step", 100)). //<br>
                 next(step("End Step")). //<br>
                 build();<br>
     }
In order to see how Jennifer monitors the prepared spring batch sample codes, go to the Advanced Agent option and set the enable_spring_batch option to true.
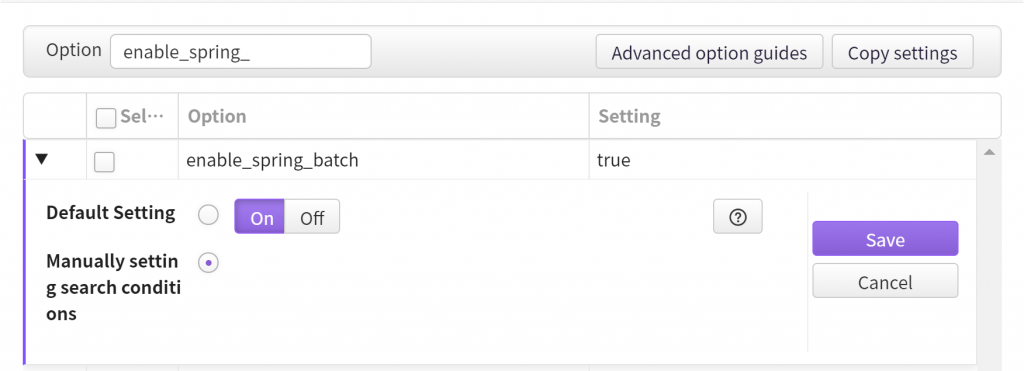
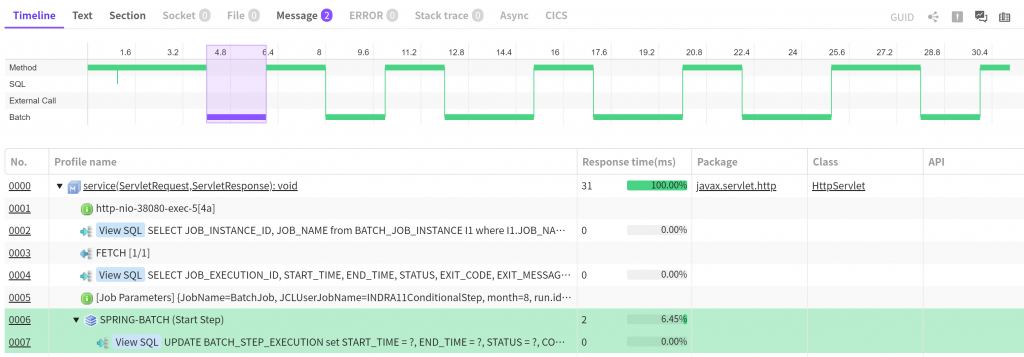
Once the setting is done as above and spring batch job execution transaction is run, then as shown in the following, you can see the name and execution details of job running within the transaction.
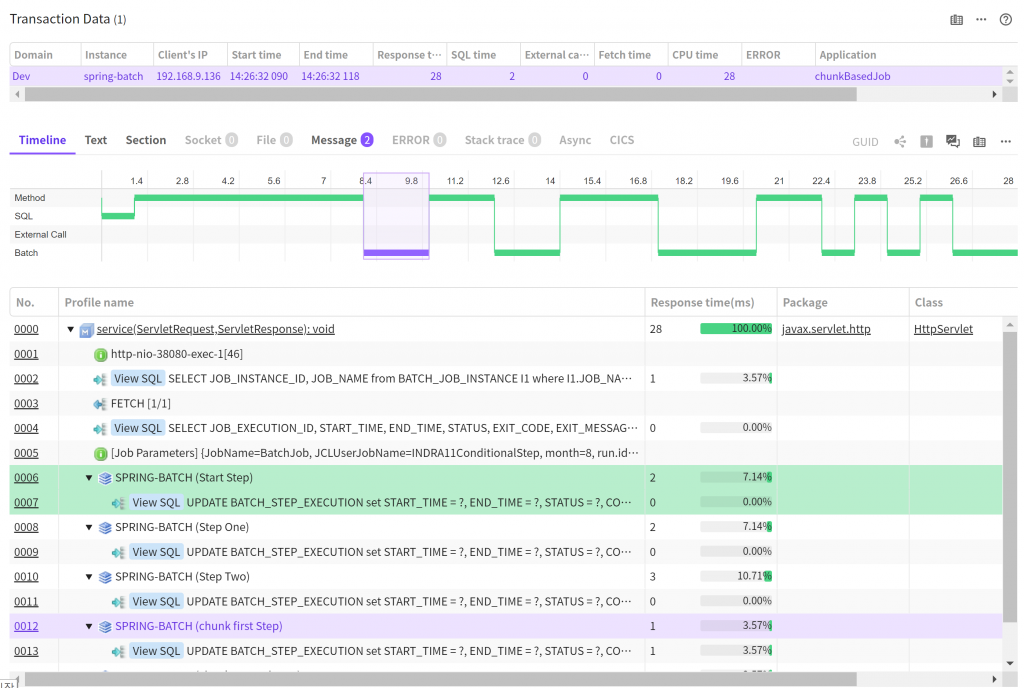

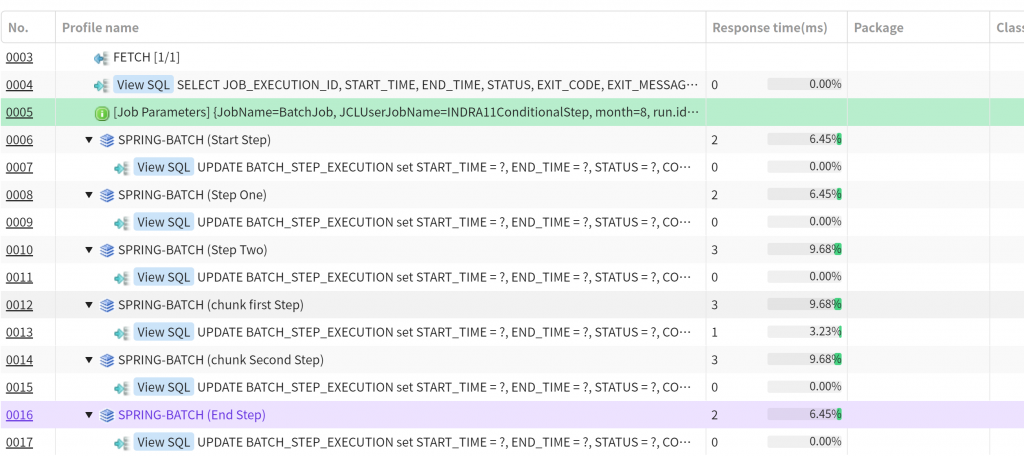
Especially, X-view timeline shows the portion of time occupied by the individual job running individually in the entire transaction, so it can be very helpful in understanding the job performance.
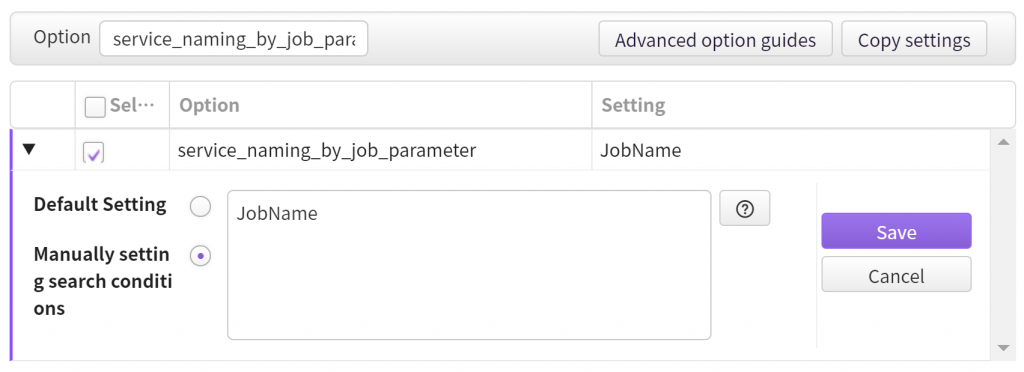
And, if you want to use the name of the batch job executing each job as a transaction name, then go to the Advanced Agent option and set JobName in the service_naming_by_job_parameter as follows.
And, if you want to use the name of the batch job executing each job as a transaction name, then go to the Advanced Agent option and set JobName in the service_naming_by_job_parameter as follows.

With this simple Jennifer option setting, you will be able to check the bottleneck point of performance while monitoring spring batch transactions.
For more details about spring batch monitoring in terms of technical information or batch job profiling methods, then you are always welcome to contact tech@jennfiersoft.com.
